
- PRICING
- LIVE QUOTES
- LEARN
- HELP


EN
Is It Too Late To Consider NOV (NOV) After A 62% One Year Rally?
- Investors may be wondering if NOV at around US$20.49 is offering fair value or if the recent enthusiasm has pushed the stock too far, too fast.
- The stock has posted returns of 1.5% over the last 7 days, 4.4% over the past month, 24.9% year to date and 62.4% over the last year, with a 3 year return of 46.3% and a 5 year return of 35.3%.
- Recent coverage around NOV has focused on its role in the wider energy sector and how investors are treating equipment and services providers in their portfolios. This context helps explain why the stock’s performance over the past year looks different from earlier multi year periods.
- NOV currently has a valuation score of 2/6, which means it screens as undervalued on 2 of 6 checks. The rest of this article will walk through traditional valuation methods before closing with a more complete way to think about what that score really means for you.
NOV scores just 2/6 on our valuation checks. See what other red flags we found in the full valuation breakdown.
Approach 1: NOV Discounted Cash Flow (DCF) Analysis
A Discounted Cash Flow, or DCF, model estimates what a stock could be worth by projecting the company’s future cash flows and discounting them back to today’s value using a required rate of return.
For NOV, the model used is a 2 Stage Free Cash Flow to Equity approach, based on cash flow projections in $. The latest twelve month free cash flow (FCF) is about $753.7 million. Analyst based estimates run through 2030, with projected FCF of $574.5 million in 2030. Simply Wall St then extrapolates further years using its own assumptions to build a longer term cash flow curve.
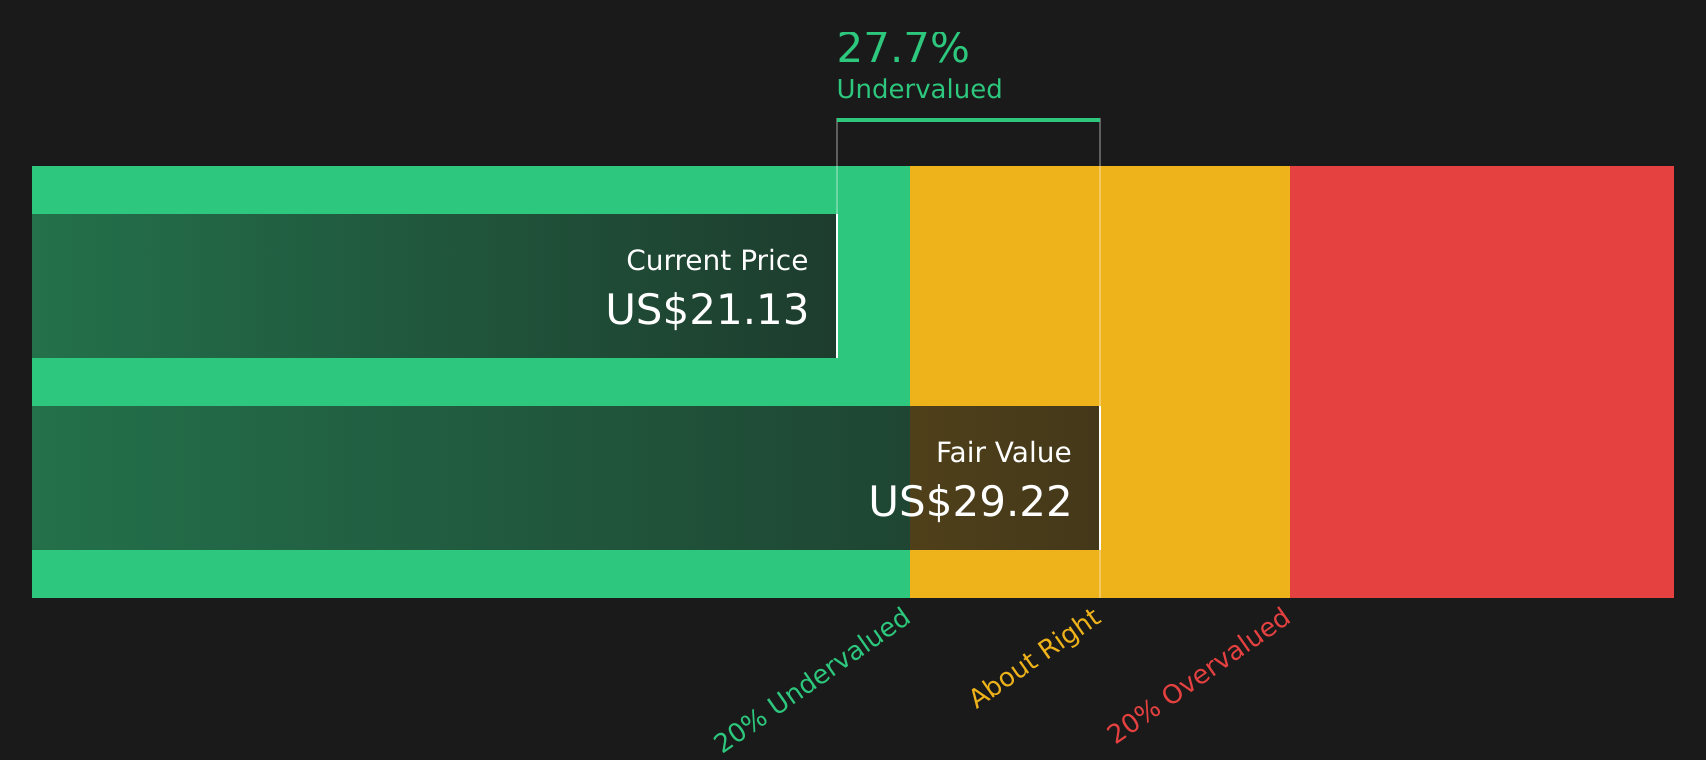
After discounting these projected cash flows, the DCF estimate arrives at an intrinsic value of about $28.24 per share. Compared with the recent share price of around $20.49, this implies NOV trades at roughly a 27.4% discount to this cash flow based estimate, which points to the stock screening as undervalued under this method.
Result: UNDERVALUED
Our Discounted Cash Flow (DCF) analysis suggests NOV is undervalued by 27.4%. Track this in your watchlist or portfolio, or discover 46 more high quality undervalued stocks.
Approach 2: NOV Price vs Earnings
For a profitable company, the P/E ratio is a useful way to relate what you pay per share to the earnings that each share generates. It gives you a quick sense of how many years of current earnings the market is pricing in for the stock.
What counts as a “normal” P/E depends on how the market views the company’s growth potential and risk. Higher expected growth or lower perceived risk can support a higher P/E, and the opposite is also true. NOV currently trades on a P/E of 80.81x, compared with the Energy Services industry average of 35.68x and a peer group average of 31.63x.
Simply Wall St’s Fair Ratio is a proprietary estimate of what NOV’s P/E “should” be, given factors like its earnings growth profile, industry, profit margins, market cap and risk. This is generally more tailored than a simple comparison with peers or industry averages, which may not fully reflect company specific strengths or weaknesses. For NOV, the Fair Ratio is 29.96x, which sits well below the current P/E of 80.81x. This suggests the stock screens as expensive on this metric.
Result: OVERVALUED

P/E ratios tell one story, but what if the real opportunity lies elsewhere? Start investing in legacies, not executives. Discover our 20 top founder-led companies.
Upgrade Your Decision Making: Choose your NOV Narrative
Earlier it was mentioned that there is an even better way to understand valuation, so Narratives are introduced here as your way of attaching a clear story about NOV to the numbers you care about, linking your view of its future revenue, earnings and margins to a forecast and then to a fair value that you can compare with the current share price.
On Simply Wall St’s Community page, Narratives let you see and build these story plus forecast combinations in an accessible way so you can quickly judge whether NOV looks interesting for you when your fair value sits above or below the current price, and because Narratives update as new information like earnings or news arrives, they adjust as the story evolves.
For NOV, one investor might align with a cautious Narrative that assumes a fair value of US$17.00 based on modest revenue growth and a future P/E of 13.8x. Another might back a more optimistic Narrative that points to a fair value of US$23.00 with slightly faster growth and a future P/E around 15.5x. Seeing these side by side helps you decide which story feels closer to your own expectations before you act.
For NOV, here are previews of two leading NOV Narratives to make comparison easier:
Fair value: US$20.65 per share
Implied discount to fair value: about 0.8% below the narrative fair value based on the recent price of US$20.49
Revenue growth assumption: 2.11% per year
- Focuses on offshore and international projects, where structural energy and infrastructure spending are expected to support NOV's technology and services revenue.
- Builds in higher profitability over time, using analyst forecasts for margins, earnings and a future P/E of 15.5x to arrive at fair value.
- Highlights trade, pricing, order timing and commodity risks that could pressure margins or delay the expected earnings profile.
Fair value: US$17.00 per share
Implied premium to fair value: about 20.5% above the narrative fair value based on the recent price of US$20.49
Revenue growth assumption: 1.08% per year
- Frames NOV as heavily exposed to traditional oil and gas, with slower revenue growth assumptions and a lower future P/E of 13.8x.
- Emphasizes energy transition, competition and funding pressures that could limit how much earnings and valuation can expand over time.
- Allows for improving earnings and margins, but still treats the current share price as richer than what the more cautious assumptions support.
Both previews use the same recent share price. Your task is to decide which set of assumptions feels closer to how you see NOV's revenue path, margin potential and long term demand for its equipment and services.
Do you think there's more to the story for NOV? Head over to our Community to see what others are saying!

This article by Simply Wall St is general in nature. We provide commentary based on historical data and analyst forecasts only using an unbiased methodology and our articles are not intended to be financial advice. It does not constitute a recommendation to buy or sell any stock, and does not take account of your objectives, or your financial situation. We aim to bring you long-term focused analysis driven by fundamental data. Note that our analysis may not factor in the latest price-sensitive company announcements or qualitative material. Simply Wall St has no position in any stocks mentioned.
Have feedback on this article? Concerned about the content? Get in touch with us directly. Alternatively, email editorial-team@simplywallst.com