
- LIVE QUOTES
- LEARN
- HELP
 Nasdaq
 Wall Street Journal
EN
Is LKQ Offering Long Term Value After a 41.9% Three Year Share Price Slide?
- If you are wondering whether LKQ is a value trap or a quietly compelling opportunity at today’s price, you are not alone. This article will unpack what the market might be missing.
- Despite trading around $28.88, the stock is down roughly 2.0% over the last week, 4.9% over the past month, and a much steeper 20.3% year to date, with a 24.2% slide over 1 year and a 41.9% drop over 3 years reshaping investors’ expectations.
- Much of the recent narrative around LKQ has focused on how macro headwinds in consumer spending and auto demand, plus ongoing shifts in the aftermarket parts landscape, are feeding into sentiment and pricing power. At the same time, the company has been in the spotlight for its strategic positioning in the global vehicle parts ecosystem and its ability to generate cash even as the sector cycles.
- Against that backdrop, LKQ currently scores a full 6/6 on our valuation checks, suggesting the market may be overly pessimistic. In the sections that follow we will break down how different valuation methods stack up, then finish with a more holistic way to judge whether the stock really is cheap or just looks that way.
Find out why LKQ's -24.2% return over the last year is lagging behind its peers.
Approach 1: LKQ Discounted Cash Flow (DCF) Analysis
A Discounted Cash Flow model estimates what a business is worth today by projecting the cash it could generate in the future and then discounting those cash flows back into today’s dollars.
For LKQ, the latest twelve month Free Cash Flow stands at about $661.7 million. Analysts and model assumptions expect this to rise steadily, with Simply Wall St using a 2 Stage Free Cash Flow to Equity approach that blends analyst forecasts with more moderate long term growth. Under this framework, projected Free Cash Flow reaches roughly $1.19 billion by 2035 as the business continues to scale its parts distribution network.
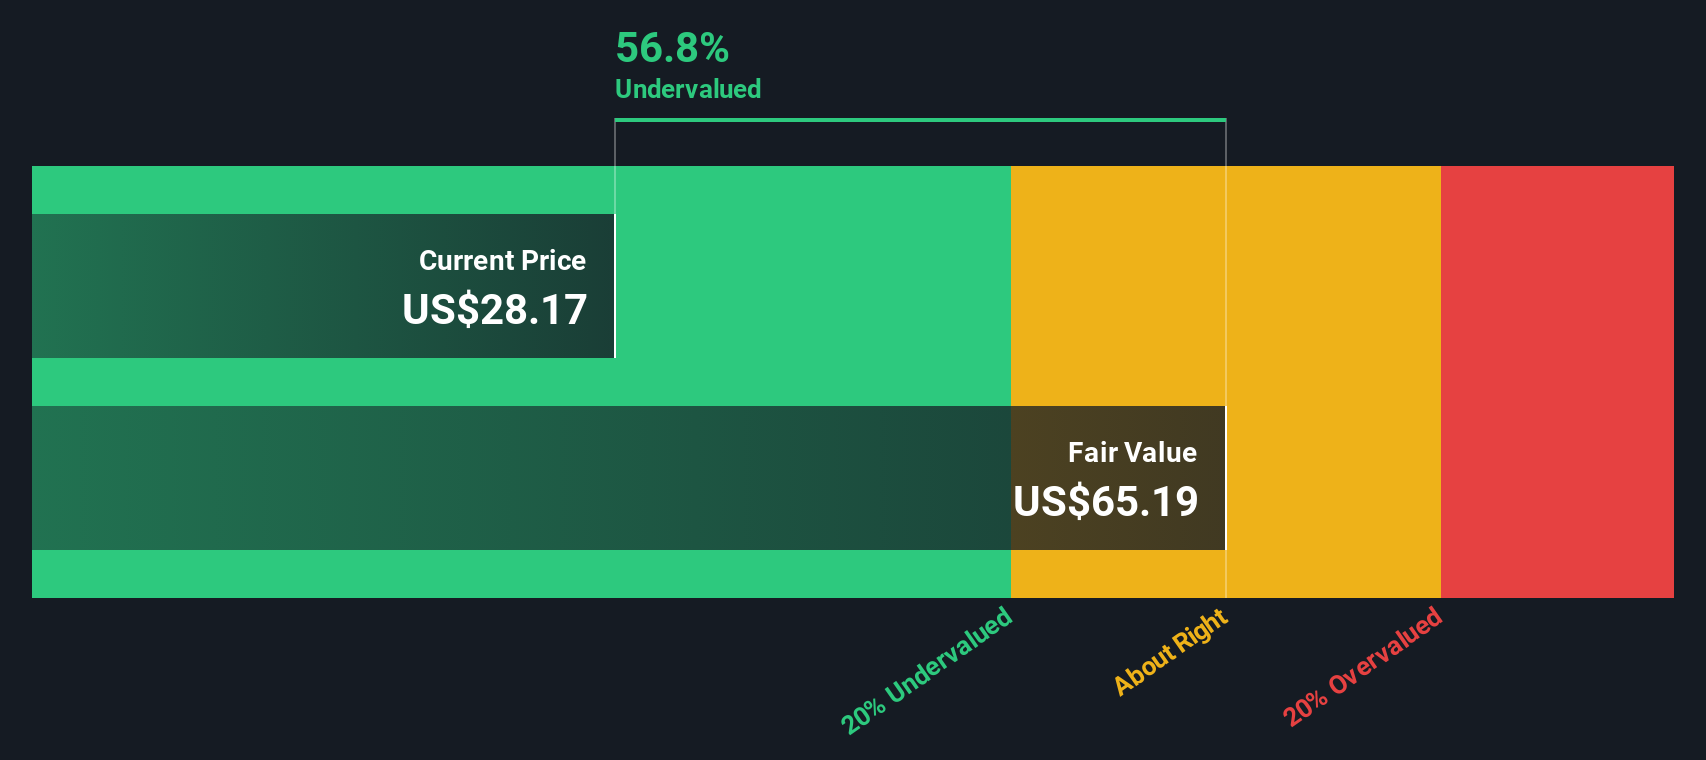
When all those future cash flows are discounted back, the model arrives at an intrinsic value of about $67.10 per share, compared with the current price of roughly $28.88. That implies the shares trade at around a 57.0% discount to the DCF estimate, suggesting the market is pricing in far weaker cash generation than the model assumes.
Result: UNDERVALUED
Our Discounted Cash Flow (DCF) analysis suggests LKQ is undervalued by 57.0%. Track this in your watchlist or portfolio, or discover 903 more undervalued stocks based on cash flows.
Approach 2: LKQ Price vs Earnings
For a consistently profitable business like LKQ, the Price to Earnings ratio is a practical way to gauge how much investors are paying for each dollar of earnings. In simple terms, higher growth and lower perceived risk usually justify a higher PE multiple, while slower growth or greater uncertainty tend to push a fair PE lower.
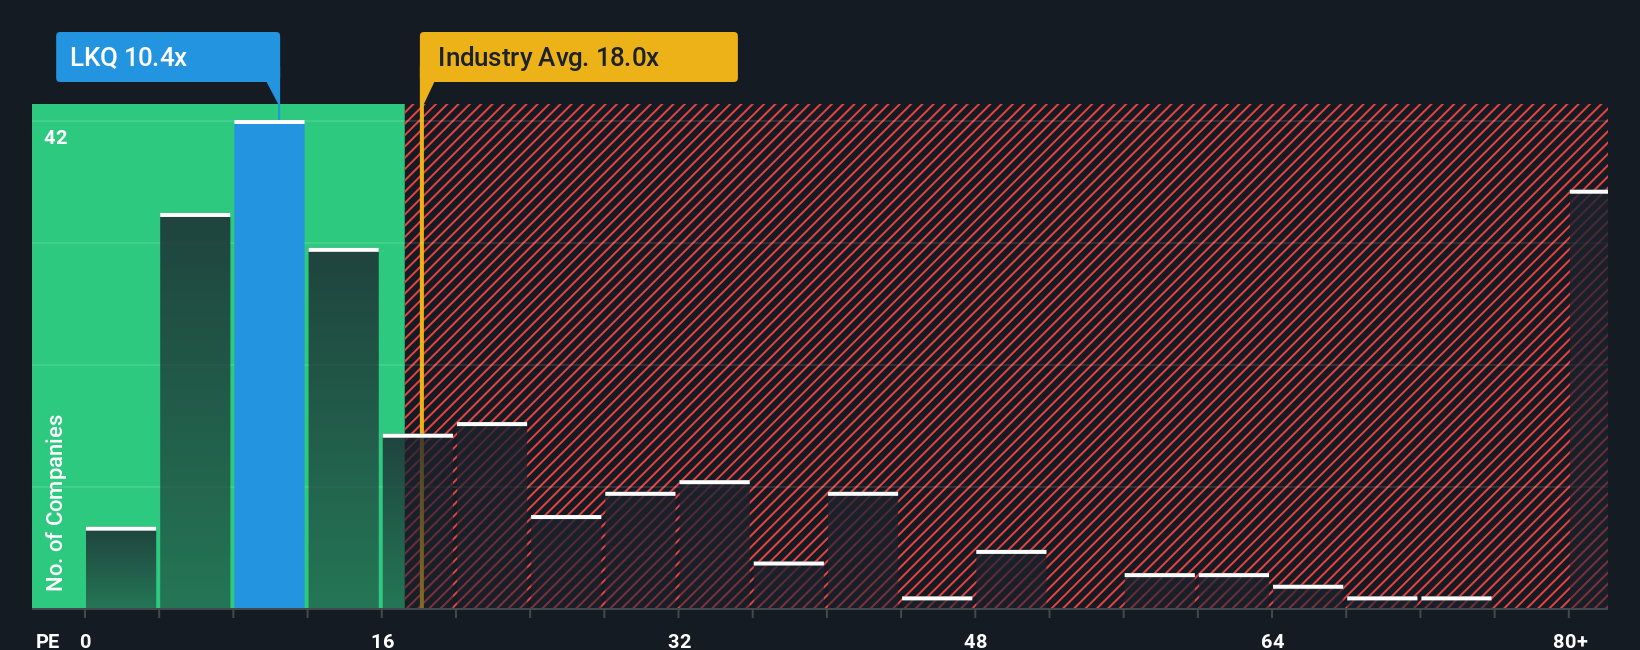
LKQ currently trades on a PE of about 10.6x, which is well below both the Retail Distributors industry average of roughly 17.7x and the broader peer group near 39.0x. To move beyond these blunt comparisons, Simply Wall St uses a Fair Ratio model, which estimates what LKQ’s PE should be after accounting for its earnings growth outlook, profitability, industry, market cap and stock specific risks. For LKQ, that Fair Ratio sits around 15.8x, which suggests the market is assigning a noticeably lower multiple than the company’s fundamentals might warrant.
On this basis, even after allowing for sector headwinds and cyclical uncertainty, LKQ screens as undervalued on earnings.
Result: UNDERVALUED
PE ratios tell one story, but what if the real opportunity lies elsewhere? Discover 1452 companies where insiders are betting big on explosive growth.
Upgrade Your Decision Making: Choose your LKQ Narrative
Earlier we mentioned that there is an even better way to understand valuation, so let us introduce you to Narratives, a simple framework on Simply Wall St’s Community page that connects a company’s story to a financial forecast and then to a fair value estimate.
A Narrative is your interpretation of a business written as a story behind the numbers. In it, you spell out what you expect for LKQ’s future revenue, earnings and margins. You then translate that into a fair value that you can compare with today’s share price to help you decide whether to buy, hold or sell.
Narratives on the platform are updated dynamically when new information such as earnings, guidance or major news arrives. This means your view of fair value and your conviction can evolve in real time as the facts change, rather than being locked into a static model.
For LKQ, one investor Narrative might assume stronger growth in miles driven, hybrid adoption and cost savings, leading to a fair value near 52.8 dollars per share. A more cautious Narrative, focused on European execution risk and slower growth, could land closer to 42.9 dollars. That range illustrates how different yet structured perspectives can coexist.
Do you think there's more to the story for LKQ? Head over to our Community to see what others are saying!

This article by Simply Wall St is general in nature. We provide commentary based on historical data and analyst forecasts only using an unbiased methodology and our articles are not intended to be financial advice. It does not constitute a recommendation to buy or sell any stock, and does not take account of your objectives, or your financial situation. We aim to bring you long-term focused analysis driven by fundamental data. Note that our analysis may not factor in the latest price-sensitive company announcements or qualitative material. Simply Wall St has no position in any stocks mentioned.
Have feedback on this article? Concerned about the content? Get in touch with us directly. Alternatively, email editorial-team@simplywallst.com