
- LIVE QUOTES
- LEARN
- HELP
 Nasdaq
 Wall Street Journal
EN
Ain Holdings Inc.'s (TSE:9627) Stock Is Going Strong: Have Financials A Role To Play?
Most readers would already be aware that Ain Holdings' (TSE:9627) stock increased significantly by 17% over the past three months. We wonder if and what role the company's financials play in that price change as a company's long-term fundamentals usually dictate market outcomes. Particularly, we will be paying attention to Ain Holdings' ROE today.
Return on Equity or ROE is a test of how effectively a company is growing its value and managing investors’ money. Put another way, it reveals the company's success at turning shareholder investments into profits.
How Is ROE Calculated?
ROE can be calculated by using the formula:
Return on Equity = Net Profit (from continuing operations) ÷ Shareholders' Equity
So, based on the above formula, the ROE for Ain Holdings is:
6.7% = JP¥9.6b ÷ JP¥142b (Based on the trailing twelve months to July 2025).
The 'return' refers to a company's earnings over the last year. That means that for every ¥1 worth of shareholders' equity, the company generated ¥0.07 in profit.
Check out our latest analysis for Ain Holdings
Why Is ROE Important For Earnings Growth?
Thus far, we have learned that ROE measures how efficiently a company is generating its profits. We now need to evaluate how much profit the company reinvests or "retains" for future growth which then gives us an idea about the growth potential of the company. Assuming all else is equal, companies that have both a higher return on equity and higher profit retention are usually the ones that have a higher growth rate when compared to companies that don't have the same features.
Ain Holdings' Earnings Growth And 6.7% ROE
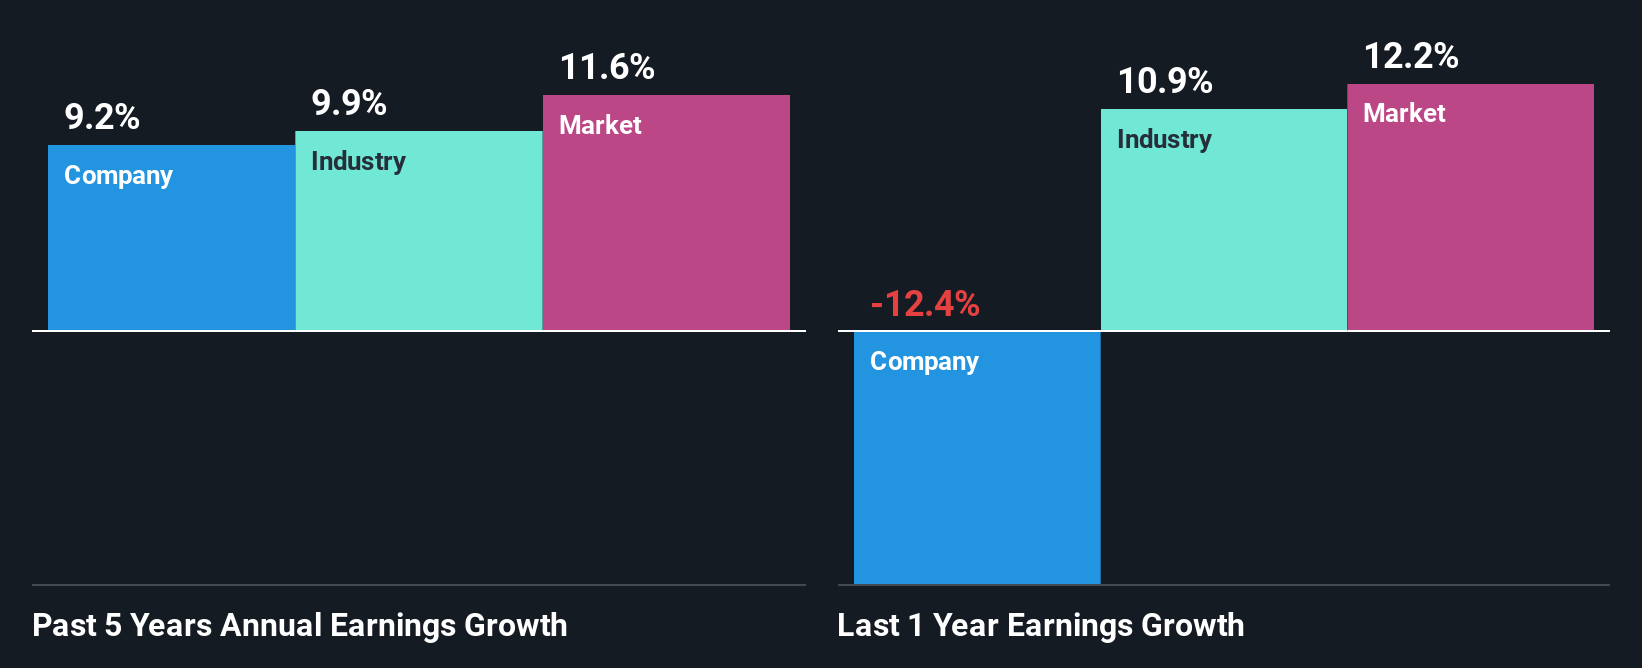
When you first look at it, Ain Holdings' ROE doesn't look that attractive. A quick further study shows that the company's ROE doesn't compare favorably to the industry average of 8.5% either. However, the moderate 9.2% net income growth seen by Ain Holdings over the past five years is definitely a positive. So, the growth in the company's earnings could probably have been caused by other variables. For example, it is possible that the company's management has made some good strategic decisions, or that the company has a low payout ratio.
Next, on comparing Ain Holdings' net income growth with the industry, we found that the company's reported growth is similar to the industry average growth rate of 9.9% over the last few years.
The basis for attaching value to a company is, to a great extent, tied to its earnings growth. The investor should try to establish if the expected growth or decline in earnings, whichever the case may be, is priced in. This then helps them determine if the stock is placed for a bright or bleak future. One good indicator of expected earnings growth is the P/E ratio which determines the price the market is willing to pay for a stock based on its earnings prospects. So, you may want to check if Ain Holdings is trading on a high P/E or a low P/E, relative to its industry.
Is Ain Holdings Making Efficient Use Of Its Profits?
Ain Holdings has a three-year median payout ratio of 26%, which implies that it retains the remaining 74% of its profits. This suggests that its dividend is well covered, and given the decent growth seen by the company, it looks like management is reinvesting its earnings efficiently.
Moreover, Ain Holdings is determined to keep sharing its profits with shareholders which we infer from its long history of paying a dividend for at least ten years.
Conclusion
In total, it does look like Ain Holdings has some positive aspects to its business. Even in spite of the low rate of return, the company has posted impressive earnings growth as a result of reinvesting heavily into its business. Having said that, looking at the current analyst estimates, we found that the company's earnings are expected to gain momentum. To know more about the company's future earnings growth forecasts take a look at this free report on analyst forecasts for the company to find out more.
Have feedback on this article? Concerned about the content? Get in touch with us directly. Alternatively, email editorial-team (at) simplywallst.com.
This article by Simply Wall St is general in nature. We provide commentary based on historical data and analyst forecasts only using an unbiased methodology and our articles are not intended to be financial advice. It does not constitute a recommendation to buy or sell any stock, and does not take account of your objectives, or your financial situation. We aim to bring you long-term focused analysis driven by fundamental data. Note that our analysis may not factor in the latest price-sensitive company announcements or qualitative material. Simply Wall St has no position in any stocks mentioned.