
- LIVE QUOTES
- LEARN
- HELP
 Nasdaq
 Wall Street Journal
EN
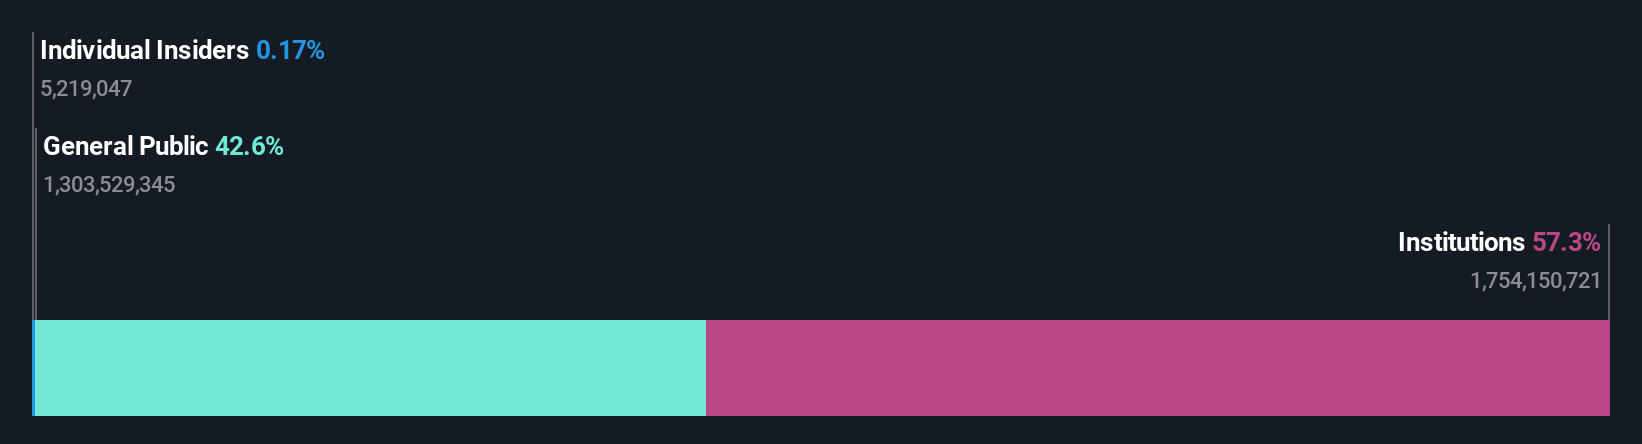
With 57% institutional ownership, Investor AB (publ) (STO:INVE A) is a favorite amongst the big guns
Key Insights
- Significantly high institutional ownership implies Investor's stock price is sensitive to their trading actions
- A total of 17 investors have a majority stake in the company with 50% ownership
- Past performance of a company along with ownership data serve to give a strong idea about prospects for a business
To get a sense of who is truly in control of Investor AB (publ) (STO:INVE A), it is important to understand the ownership structure of the business. We can see that institutions own the lion's share in the company with 57% ownership. In other words, the group stands to gain the most (or lose the most) from their investment into the company.
Because institutional owners have a huge pool of resources and liquidity, their investing decisions tend to carry a great deal of weight, especially with individual investors. Hence, having a considerable amount of institutional money invested in a company is often regarded as a desirable trait.
Let's delve deeper into each type of owner of Investor, beginning with the chart below.
See our latest analysis for Investor
What Does The Institutional Ownership Tell Us About Investor?
Institutional investors commonly compare their own returns to the returns of a commonly followed index. So they generally do consider buying larger companies that are included in the relevant benchmark index.
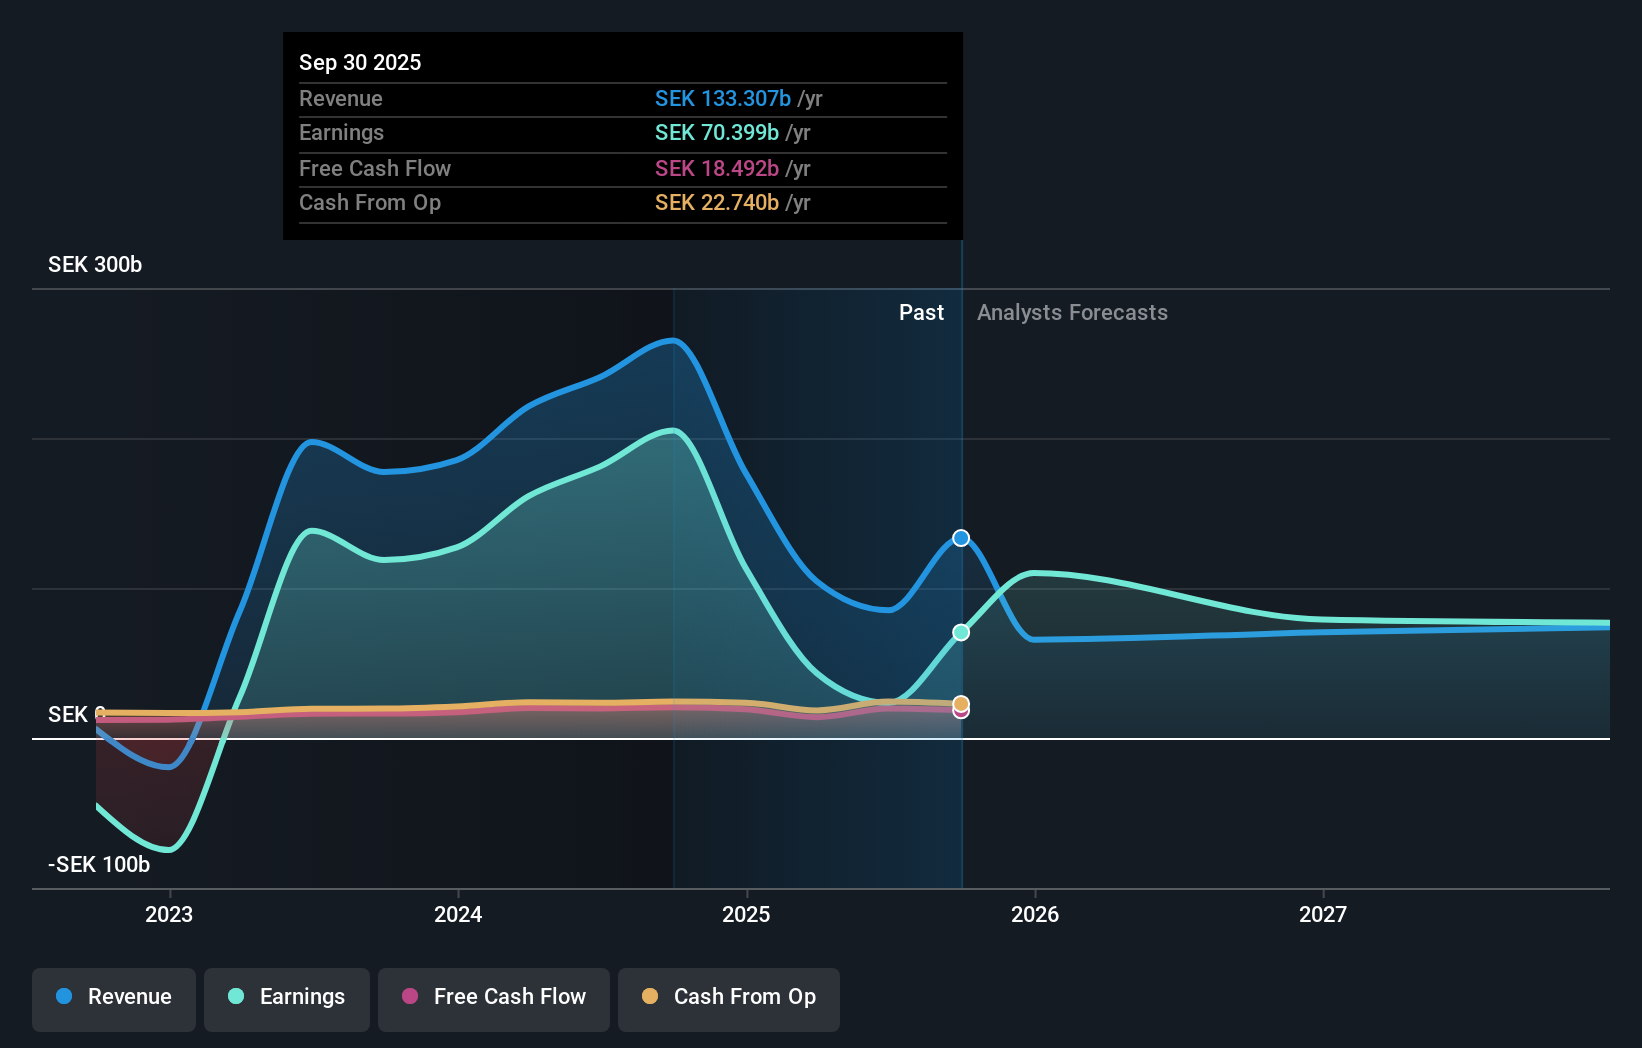
As you can see, institutional investors have a fair amount of stake in Investor. This suggests some credibility amongst professional investors. But we can't rely on that fact alone since institutions make bad investments sometimes, just like everyone does. When multiple institutions own a stock, there's always a risk that they are in a 'crowded trade'. When such a trade goes wrong, multiple parties may compete to sell stock fast. This risk is higher in a company without a history of growth. You can see Investor's historic earnings and revenue below, but keep in mind there's always more to the story.
Institutional investors own over 50% of the company, so together than can probably strongly influence board decisions. We note that hedge funds don't have a meaningful investment in Investor. Knut and Alice Wallenberg Foundation is currently the company's largest shareholder with 20% of shares outstanding. Meanwhile, the second and third largest shareholders, hold 3.6% and 3.5%, of the shares outstanding, respectively.
A closer look at our ownership figures suggests that the top 17 shareholders have a combined ownership of 50% implying that no single shareholder has a majority.
While studying institutional ownership for a company can add value to your research, it is also a good practice to research analyst recommendations to get a deeper understand of a stock's expected performance. There is a little analyst coverage of the stock, but not much. So there is room for it to gain more coverage.
Insider Ownership Of Investor
The definition of an insider can differ slightly between different countries, but members of the board of directors always count. The company management answer to the board and the latter should represent the interests of shareholders. Notably, sometimes top-level managers are on the board themselves.
I generally consider insider ownership to be a good thing. However, on some occasions it makes it more difficult for other shareholders to hold the board accountable for decisions.
Our data suggests that insiders own under 1% of Investor AB (publ) in their own names. It is a very large company, so it would be surprising to see insiders own a large proportion of the company. Though their holding amounts to less than 1%, we can see that board members collectively own kr1.7b worth of shares (at current prices). It is always good to see at least some insider ownership, but it might be worth checking if those insiders have been selling.
General Public Ownership
With a 43% ownership, the general public, mostly comprising of individual investors, have some degree of sway over Investor. This size of ownership, while considerable, may not be enough to change company policy if the decision is not in sync with other large shareholders.
Next Steps:
I find it very interesting to look at who exactly owns a company. But to truly gain insight, we need to consider other information, too. Take risks for example - Investor has 2 warning signs (and 1 which can't be ignored) we think you should know about.
If you would prefer discover what analysts are predicting in terms of future growth, do not miss this free report on analyst forecasts.
NB: Figures in this article are calculated using data from the last twelve months, which refer to the 12-month period ending on the last date of the month the financial statement is dated. This may not be consistent with full year annual report figures.
Have feedback on this article? Concerned about the content? Get in touch with us directly. Alternatively, email editorial-team (at) simplywallst.com.
This article by Simply Wall St is general in nature. We provide commentary based on historical data and analyst forecasts only using an unbiased methodology and our articles are not intended to be financial advice. It does not constitute a recommendation to buy or sell any stock, and does not take account of your objectives, or your financial situation. We aim to bring you long-term focused analysis driven by fundamental data. Note that our analysis may not factor in the latest price-sensitive company announcements or qualitative material. Simply Wall St has no position in any stocks mentioned.