
- LIVE QUOTES
- LEARN
- HELP
 Nasdaq
 Wall Street Journal
EN
Is Xylem Fairly Priced After Strong 2025 Gains and Cooling Momentum?
- Wondering if Xylem at around $139 is still a smart buy or if most of the upside is already priced in? You are not alone. This article will unpack what the current share price might be telling us about potential future returns.
- Despite a solid 19.9% gain year to date and 11.3% over the last year, the stock has recently cooled off. It is down 1.2% over the past week and 7.7% over the last month, which could be signalling a shift in risk perception or a breather after a strong run.
- Recent news flow around water infrastructure investment, sustainability focused spending, and tightening global water regulations has kept Xylem in the spotlight, as investors look for companies that can benefit from long term upgrades to critical water systems. In addition, growing attention on climate resilience and smart utility networks has reinforced Xylem's positioning as a picks and shovels player in an area where demand is driven more by necessity than by consumer sentiment.
- Even so, Xylem only scores 1 out of 6 on our valuation checks for undervaluation, which suggests the stock may not be a straightforward bargain at first glance. Next we will walk through different valuation approaches to see how fair that score really is, before finishing with a more holistic way to think about Xylem's true value.
Xylem scores just 1/6 on our valuation checks. See what other red flags we found in the full valuation breakdown.
Approach 1: Xylem Discounted Cash Flow (DCF) Analysis
A Discounted Cash Flow model estimates what a company is worth by projecting the cash it can generate in the future and then discounting those cash flows back to today in $ terms. For Xylem, the 2 Stage Free Cash Flow to Equity model starts from last twelve months Free Cash Flow of about $927 million and applies analyst forecasts for the next few years, then tapers growth beyond that using Simply Wall St extrapolations.
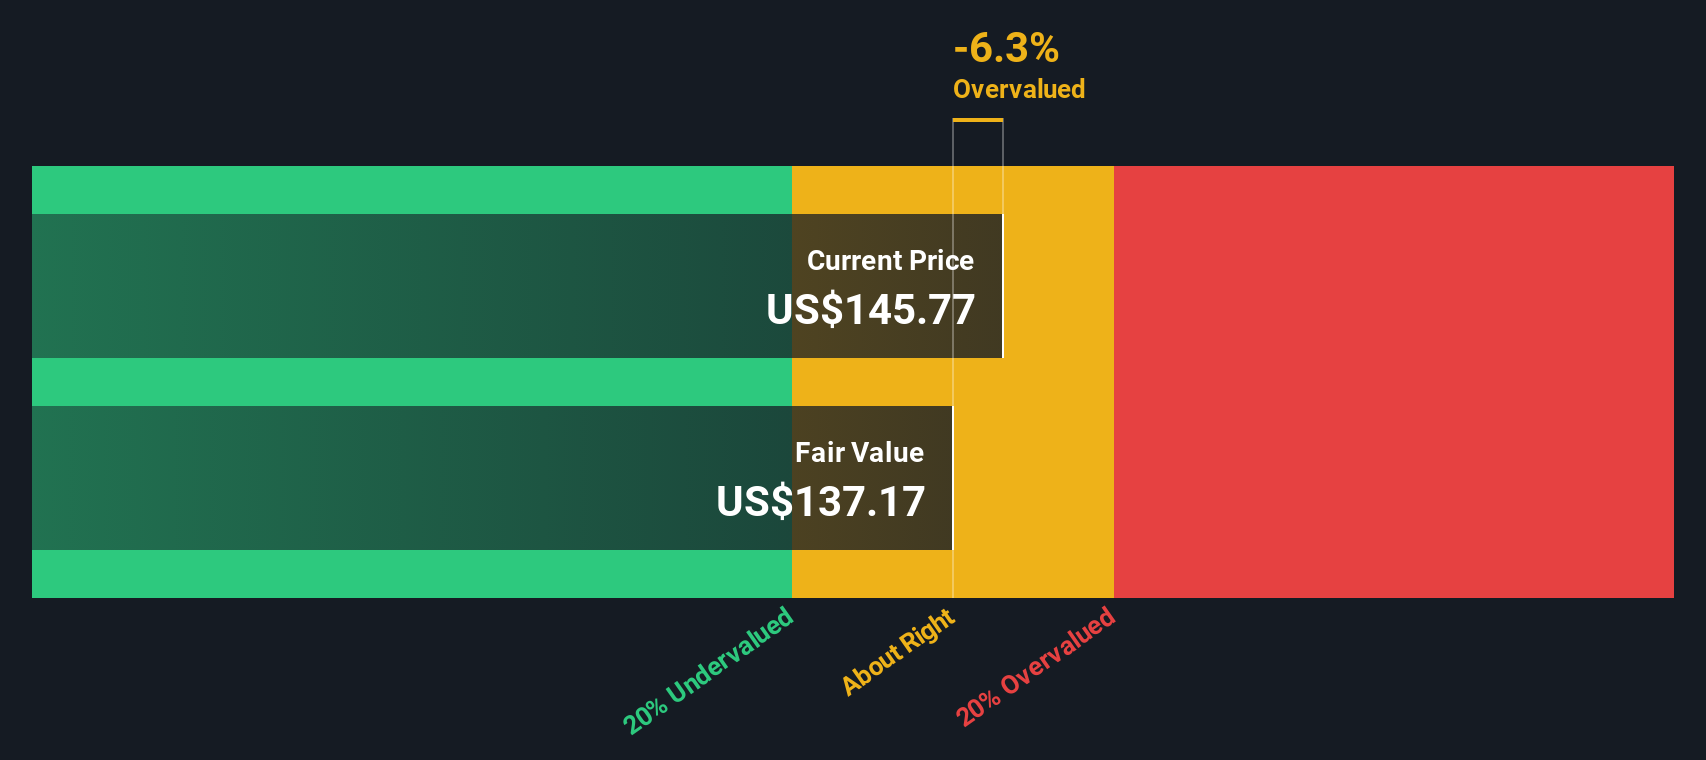
Analysts see Free Cash Flow rising to around $1.37 billion by 2027, with longer term projections reaching roughly $2.39 billion by 2035, reflecting solid but gradually slowing growth as the business matures. When all those future cash flows are discounted back to today, the model arrives at an intrinsic value of about $136.44 per share.
With Xylem trading around $139, the DCF implies the stock is roughly 1.9% overvalued, which is effectively in the margin of error for this kind of model rather than a clear red flag.
Result: ABOUT RIGHT
Xylem is fairly valued according to our Discounted Cash Flow (DCF), but this can change at a moment's notice. Track the value in your watchlist or portfolio and be alerted on when to act.
Approach 2: Xylem Price vs Earnings
For profitable companies like Xylem, the price to earnings ratio is a practical way to judge valuation because it directly links what investors are paying to the profits the business is already generating. In general, faster growing, higher quality businesses with more predictable earnings can justify a higher PE ratio, while slower, riskier, or more cyclical companies usually deserve a lower one.
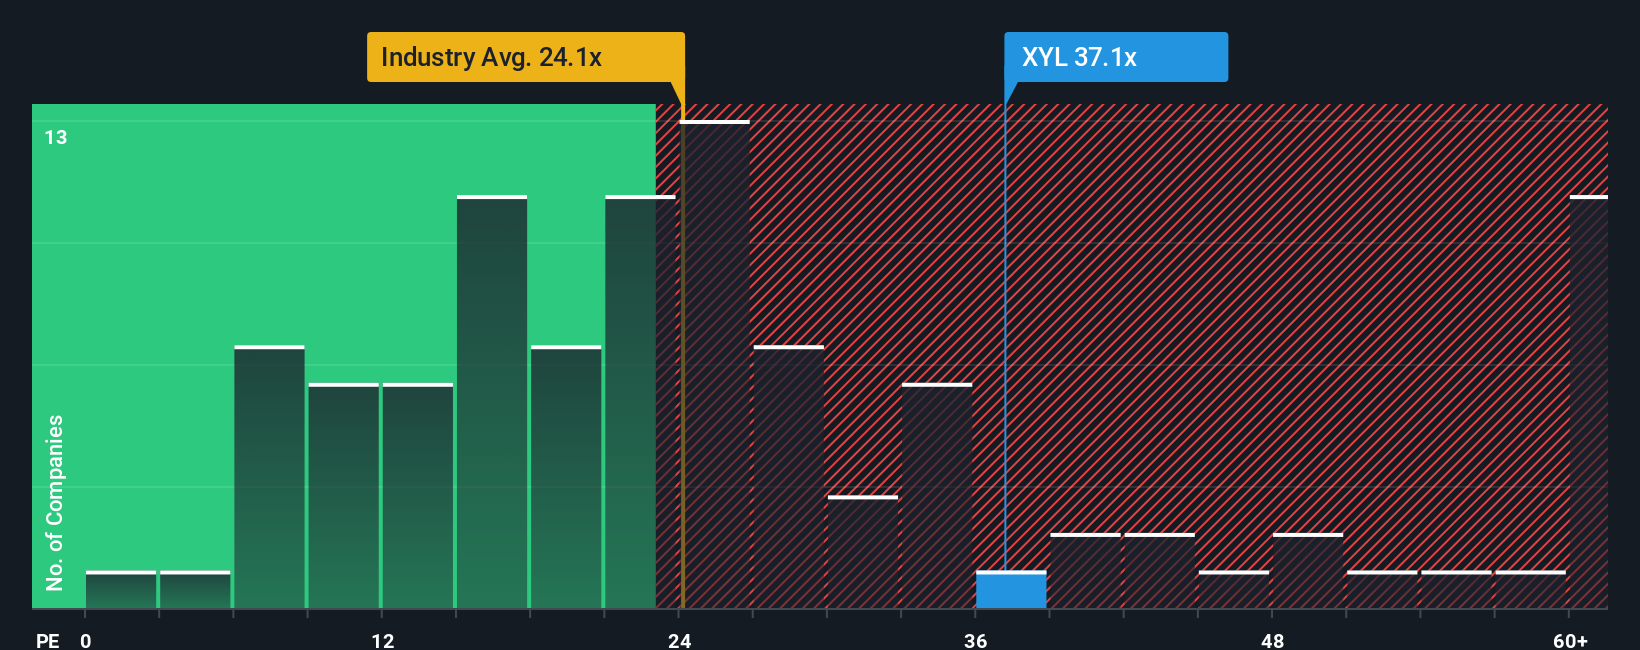
Xylem currently trades on about 35.7x earnings, a premium to both the machinery industry average of roughly 25.5x and its peer group average of about 31.4x. To go a step further than these blunt comparisons, Simply Wall St calculates a “Fair Ratio” for each stock, which estimates the PE multiple that makes sense given its earnings growth outlook, profitability, industry, market cap and specific risks. This Fair Ratio is 28.5x for Xylem, which is meaningfully below the current PE and suggests the market is paying up more than those fundamentals alone would justify.
Result: OVERVALUED
PE ratios tell one story, but what if the real opportunity lies elsewhere? Discover 1442 companies where insiders are betting big on explosive growth.
Upgrade Your Decision Making: Choose your Xylem Narrative
Earlier we mentioned that there is an even better way to understand valuation, so let us introduce you to Narratives, a simple framework that lets you attach a clear story about a company to the numbers you care about, such as your fair value estimate and expectations for future revenue, earnings and margins.
A Narrative connects three things: the business story, a financial forecast, and a resulting fair value. On Simply Wall St you can build and compare these Narratives on the Community page that millions of investors already use.
This can help investors decide when they might want to buy or sell, because you can constantly compare your Narrative-based fair value to Xylem's live share price and see whether the stock still looks attractive or has become stretched.
Because Narratives update dynamically when new information arrives, such as earnings results or major news, you can quickly see how a change in Xylem's outlook could flow through to revenue assumptions, margins and your fair value, rather than reacting only to price moves.
For example, one bullish Xylem Narrative might see the stock as worth around $175 based on faster adoption of smart infrastructure and stronger margins, while a more cautious Narrative might cap fair value near $125 due to concerns about funding cycles and execution risks.
Do you think there's more to the story for Xylem? Head over to our Community to see what others are saying!
This article by Simply Wall St is general in nature. We provide commentary based on historical data and analyst forecasts only using an unbiased methodology and our articles are not intended to be financial advice. It does not constitute a recommendation to buy or sell any stock, and does not take account of your objectives, or your financial situation. We aim to bring you long-term focused analysis driven by fundamental data. Note that our analysis may not factor in the latest price-sensitive company announcements or qualitative material. Simply Wall St has no position in any stocks mentioned.
Have feedback on this article? Concerned about the content? Get in touch with us directly. Alternatively, email editorial-team@simplywallst.com