
- LIVE QUOTES
- LEARN
- HELP
 Nasdaq
 Wall Street Journal
EN
Best Buy (BBY): Has the Recent Share Price Slide Opened a Valuation Opportunity?
Best Buy (BBY) has been sliding this month, with the stock down about 8% and roughly 14% year to date, even as earnings and net income continue to inch higher in the background.
See our latest analysis for Best Buy.
At around $74.17, the share price has drifted lower in recent weeks. A weaker 30 day share price return now sits alongside a mildly negative one year total shareholder return, suggesting sentiment has cooled even as earnings trends remain solid.
If Best Buy’s recent pullback has you reassessing retail, this could be a good moment to look beyond the sector and explore fast growing stocks with high insider ownership.
With earnings growing faster than sales, a sizeable discount to analyst targets and a low intrinsic value score hint at mispricing. But is Best Buy genuinely undervalued here, or is the market already baking in its next leg of growth?
Most Popular Narrative: 11.7% Undervalued
With Best Buy closing at $74.17 against a narrative fair value of $83.95, the valuation case leans on a steady, compounding earnings story.
Ongoing investment in advanced supply chain automation, data driven fulfillment, and omnichannel capabilities is reducing operating expenses, optimizing inventory, and enabling faster delivery and improved customer satisfaction, which collectively should support more efficient cost structures and higher net earnings longer term.
Want to see what kind of revenue trajectory and margin rebuild justify that higher fair value tag? The narrative leans on disciplined costs, richer service mix, and a surprisingly modest future earnings multiple. Curious how those moving parts add up to this price?
Result: Fair Value of $83.95 (UNDERVALUED)
Have a read of the narrative in full and understand what's behind the forecasts.
However, slower consumer electronics demand and intensifying online competition could pressure margins and stall the earnings and multiple expansion that this narrative leans on.Find out about the key risks to this Best Buy narrative.
Another View: Market Ratios Flash a Caution Sign
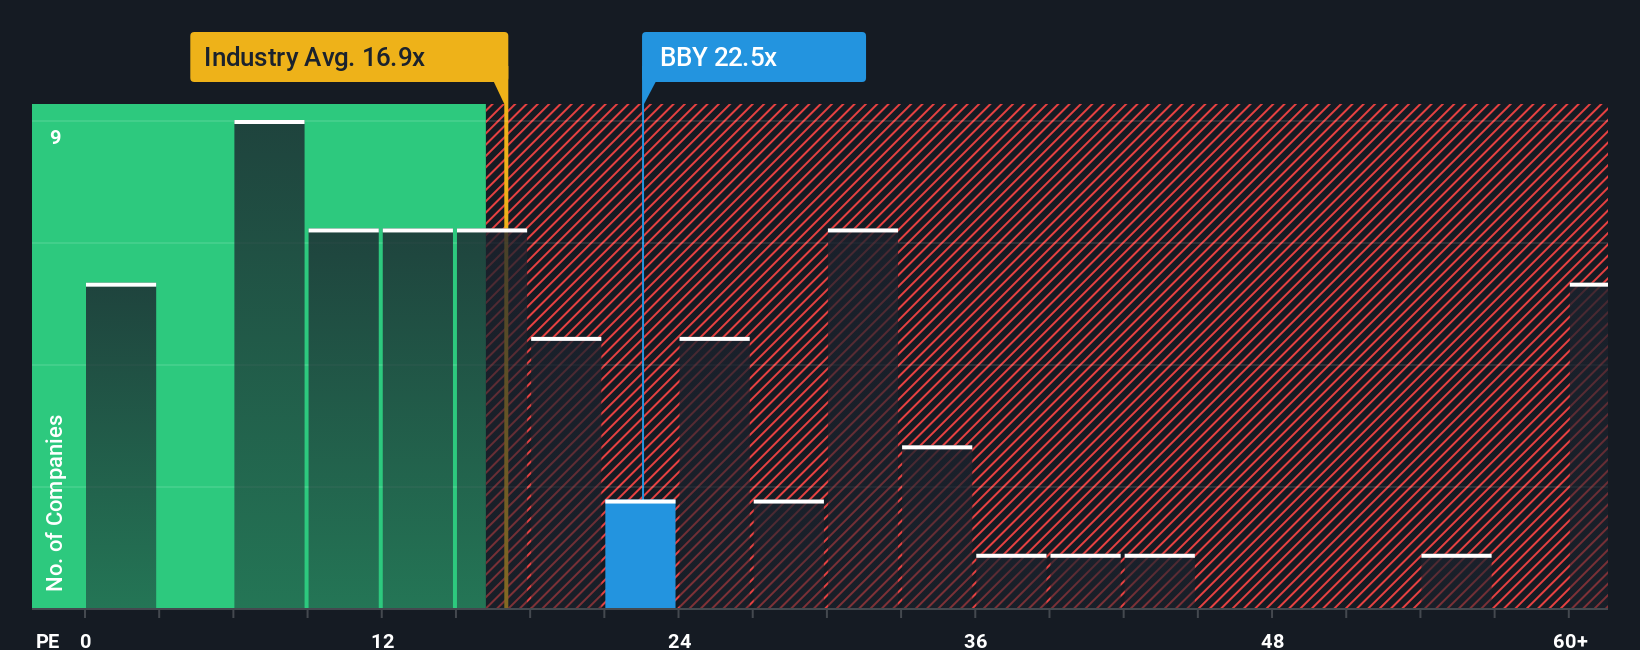
While narrative fair values suggest upside, today’s valuation ratios tell a cooler story. Best Buy trades at 24.2 times earnings, above both the US Specialty Retail average of 18.4 times and its own fair ratio of 23.2 times. This gap hints at a thinner margin of safety than the narrative alone might suggest.
See what the numbers say about this price — find out in our valuation breakdown.
Build Your Own Best Buy Narrative
If you are unconvinced by these views, or simply want to dig into the numbers yourself, you can craft a custom narrative in just a few minutes: Do it your way.
A great starting point for your Best Buy research is our analysis highlighting 2 key rewards and 3 important warning signs that could impact your investment decision.
Ready for your next investing move?
Before you move on, lock in your next smart idea with a focused search on the Simply Wall St Screener and avoid leaving high potential opportunities on the table.
- Secure steadier portfolio income by targeting companies in these 15 dividend stocks with yields > 3% that may keep paying you even when markets turn choppy.
- Position yourself early in game changing innovation by reviewing these 28 quantum computing stocks that could benefit from breakthroughs in computing power.
- Tap into high growth potential by scanning these 26 AI penny stocks riding structural demand for automation, data processing, and intelligent software.
This article by Simply Wall St is general in nature. We provide commentary based on historical data and analyst forecasts only using an unbiased methodology and our articles are not intended to be financial advice. It does not constitute a recommendation to buy or sell any stock, and does not take account of your objectives, or your financial situation. We aim to bring you long-term focused analysis driven by fundamental data. Note that our analysis may not factor in the latest price-sensitive company announcements or qualitative material. Simply Wall St has no position in any stocks mentioned.
Have feedback on this article? Concerned about the content? Get in touch with us directly. Alternatively, email editorial-team@simplywallst.com