
- LIVE QUOTES
- LEARN
- HELP
 Nasdaq
 Wall Street Journal
EN
Has KONE’s 2025 Rally and Smart Infrastructure Push Already Been Fully Priced In?
- Wondering if KONE Oyj is still a buy at around €59.62, or if most of the upside is already priced in? In this article we walk through what the current market price implies about its long term value.
- The stock has quietly outpaced the broader market, with shares up 1.8% over the last week, 2.2% over the past month, and about 24.6% year to date, adding to a 24.4% gain over the last year and 36.9% over three years.
- Recent headlines have focused on KONE's role in major urban infrastructure and modernization projects, as well as continued investment in smart elevator and escalator technologies that tie into energy efficiency and building digitization strategies. Together, these themes support the idea that investors are paying up for a resilient, service heavy business model with long term growth angles tied to urbanization and sustainability.
- Yet on our scorecard, KONE only passes 1 out of 6 undervaluation checks, giving it a valuation score of 1/6. This raises the question of whether quality and growth expectations are now fully reflected in the price. In the next sections, we break down different valuation approaches and then finish with a more holistic way of thinking about what KONE might be worth beyond the usual metrics.
KONE Oyj scores just 1/6 on our valuation checks. See what other red flags we found in the full valuation breakdown.
Approach 1: KONE Oyj Discounted Cash Flow (DCF) Analysis
A Discounted Cash Flow model estimates what a company is worth by projecting its future cash flows and then discounting those amounts back into today’s euros, to reflect risk and the time value of money.
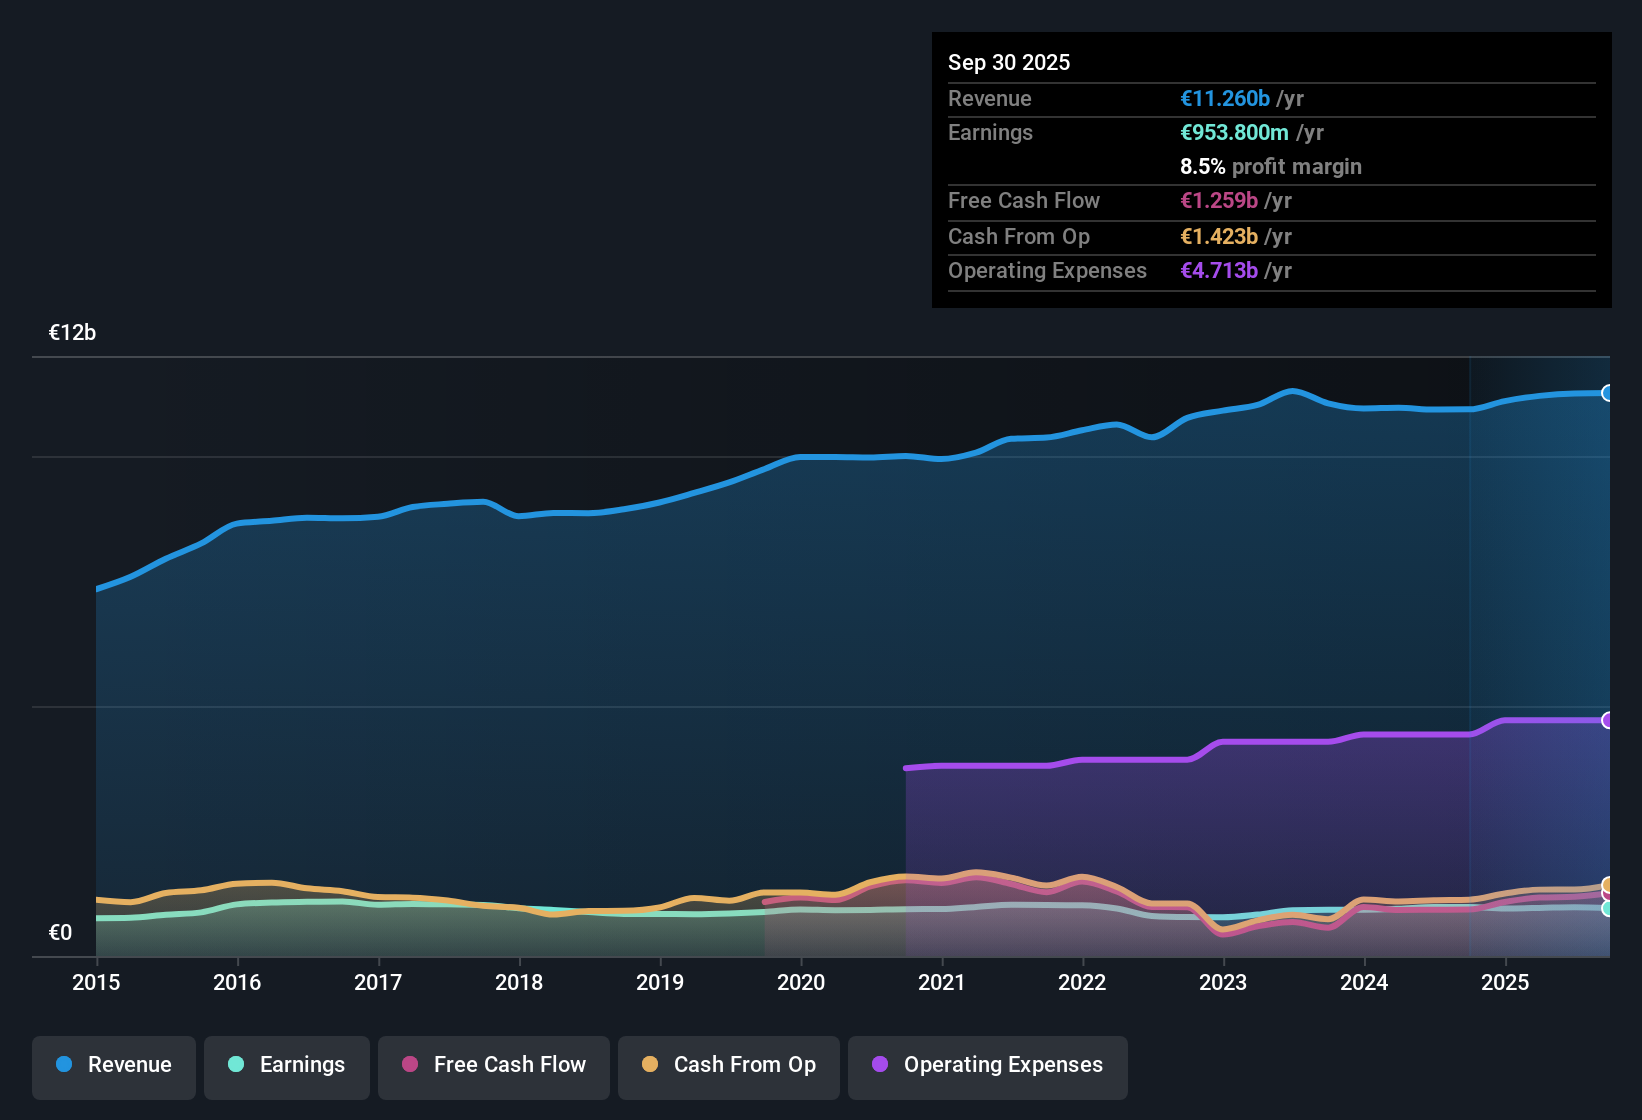
For KONE Oyj, the latest twelve month Free Cash Flow stands at about €1.24 billion. Analyst forecasts and subsequent extrapolations see this rising gradually, with projected Free Cash Flow of roughly €1.98 billion by 2035, based on a 2 Stage Free Cash Flow to Equity framework that uses detailed analyst estimates for the next few years and slower, modelled growth thereafter.
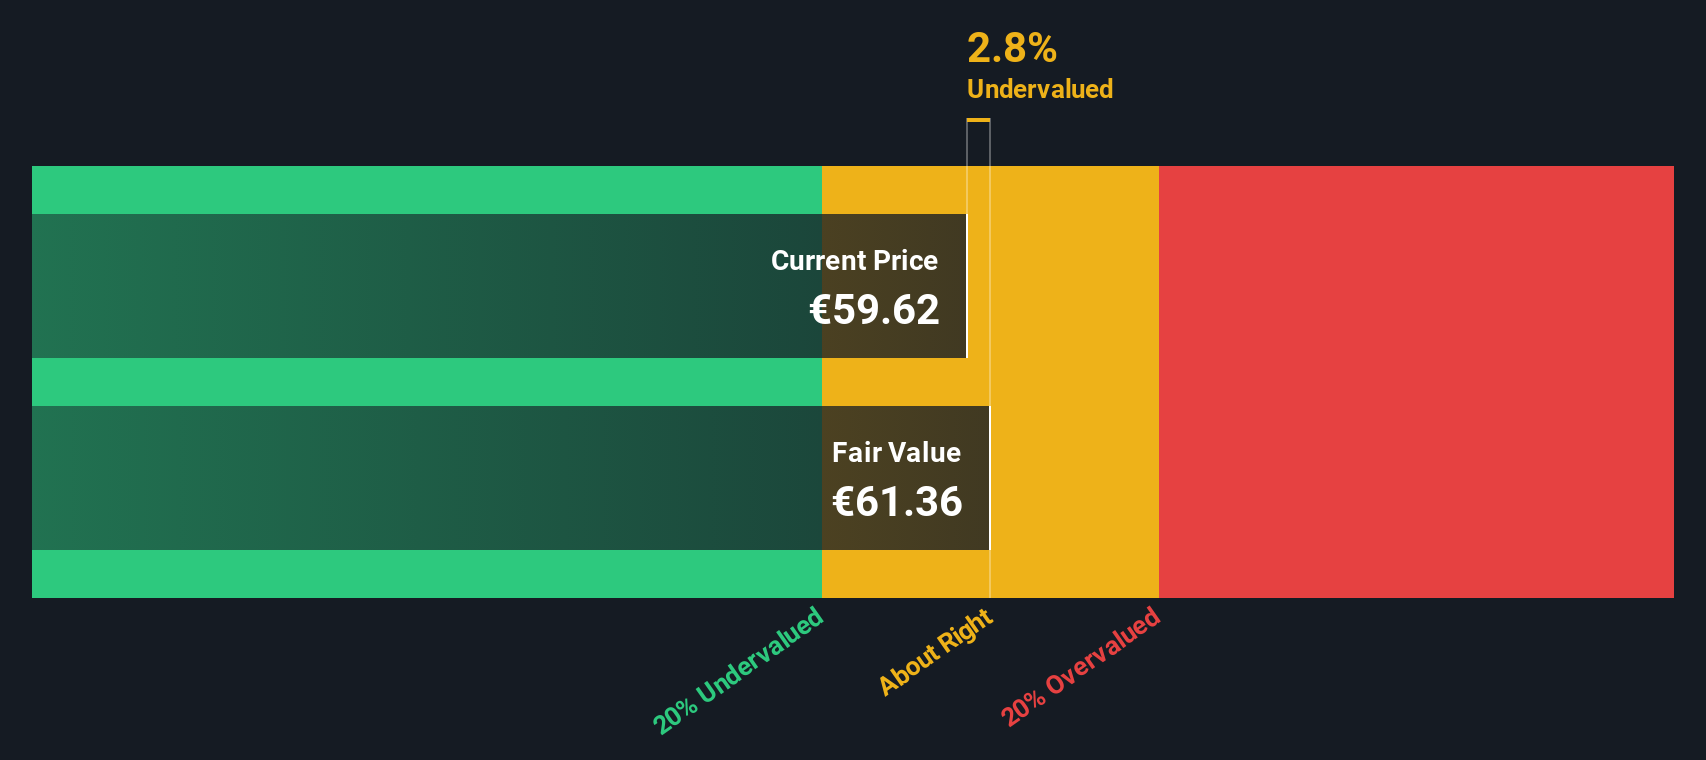
When Simply Wall St sums these discounted cash flows, the result is an intrinsic value of about €61.36 per share. Compared with the current share price around €59.62, the model suggests KONE trades on a modest 2.8% discount to its estimated fair value. This indicates the stock is only slightly undervalued on cash flow fundamentals.
Result: ABOUT RIGHT
KONE Oyj is fairly valued according to our Discounted Cash Flow (DCF), but this can change at a moment's notice. Track the value in your watchlist or portfolio and be alerted on when to act.
Approach 2: KONE Oyj Price vs Earnings
For a mature, consistently profitable business like KONE Oyj, the Price to Earnings (PE) ratio is a practical way to gauge what investors are paying for each euro of current earnings. In general, faster growth and lower perceived risk justify a higher PE, while slower growth or higher uncertainty usually call for a lower, more conservative multiple.
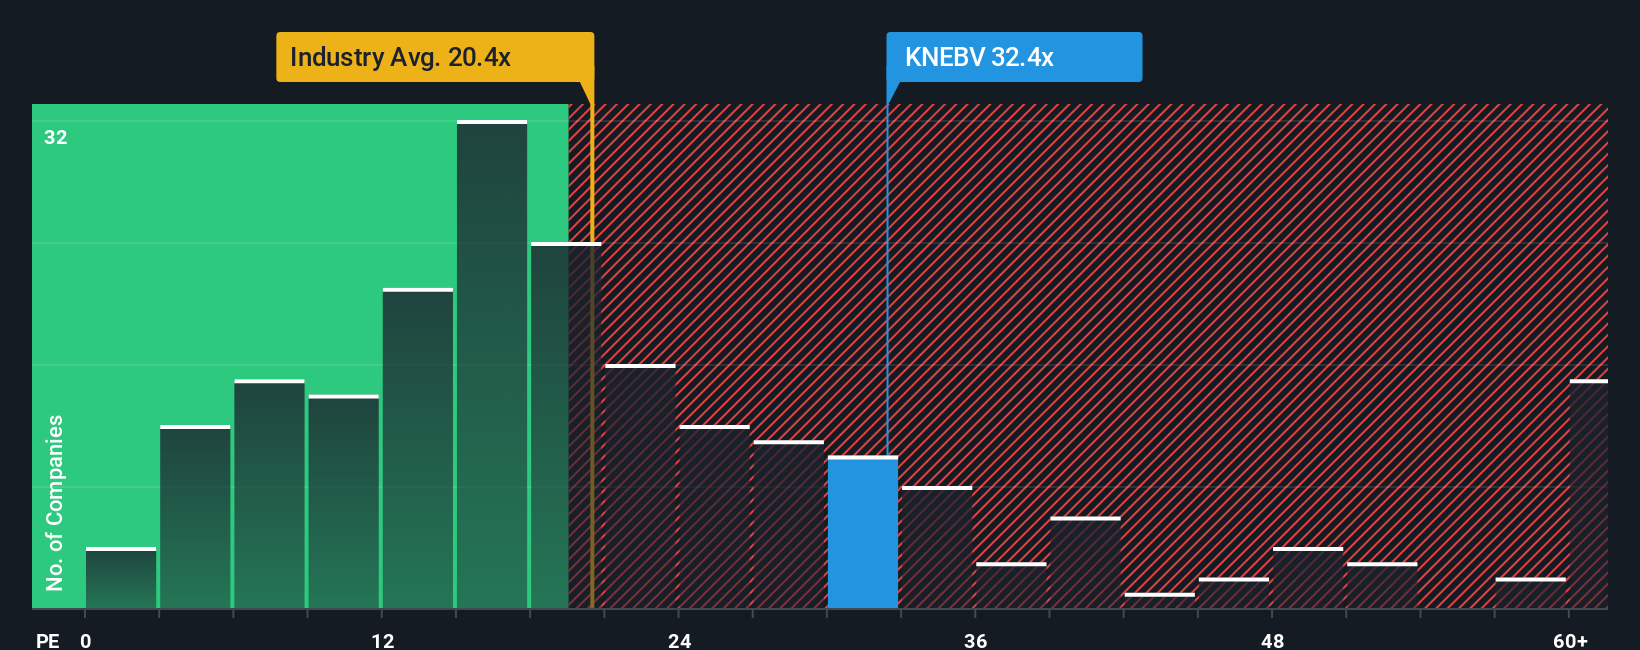
KONE currently trades on a PE of about 32.4x, which sits well above both the Machinery industry average of roughly 23.7x and the broader peer average of around 21.1x. On those simple comparisons, the stock looks expensive. However, Simply Wall St’s Fair Ratio framework goes a step further by estimating what PE KONE should trade on, given its earnings growth outlook, profit margins, industry positioning, market cap, and specific risk profile. This produces a Fair Ratio of about 24.1x, materially below today’s market multiple.
Because KONE’s actual PE of 32.4x is significantly higher than the Fair Ratio of 24.1x, the shares appear overvalued on an earnings multiple basis, even after accounting for quality and growth.
Result: OVERVALUED
PE ratios tell one story, but what if the real opportunity lies elsewhere? Discover 1442 companies where insiders are betting big on explosive growth.
Upgrade Your Decision Making: Choose your KONE Oyj Narrative
Earlier we mentioned that there is an even better way to understand valuation, so let us introduce you to Narratives, a simple tool on Simply Wall St’s Community page that lets you combine your view of a company’s story with your own forecasts for revenue, earnings and margins. You can link that forecast to a Fair Value, and then compare it to today’s price to help you decide whether KONE is a buy, hold or sell. Your Fair Value is then automatically updated as new earnings, news or guidance arrive so your thesis stays current.
Do you think there's more to the story for KONE Oyj? Head over to our Community to see what others are saying!
This article by Simply Wall St is general in nature. We provide commentary based on historical data and analyst forecasts only using an unbiased methodology and our articles are not intended to be financial advice. It does not constitute a recommendation to buy or sell any stock, and does not take account of your objectives, or your financial situation. We aim to bring you long-term focused analysis driven by fundamental data. Note that our analysis may not factor in the latest price-sensitive company announcements or qualitative material. Simply Wall St has no position in any stocks mentioned.
Have feedback on this article? Concerned about the content? Get in touch with us directly. Alternatively, email editorial-team@simplywallst.com