
- LIVE QUOTES
- LEARN
- HELP
 Nasdaq
 Wall Street Journal
EN
Is Whirlpool’s Slump and Recent Rebound Creating a Long Term Value Opportunity in 2025?
- If you are wondering whether Whirlpool's beaten down share price is quietly turning into a value opportunity, or if it is cheap for a reason, this article is for you.
- The stock has bounced about 3.3% over the last week and 12.3% in the past month, but it is still down roughly 30.6% year to date and 24.7% over the last year. That tells us the longer term market sentiment is still cautious.
- Recent headlines have focused on Whirlpool's strategic moves to sharpen its portfolio and adapt to a tougher housing and appliance demand backdrop, with investors debating whether these shifts can drive a sustainable recovery in margins and cash flows. At the same time, macro concerns around consumer spending and higher financing costs have kept many cyclical names like Whirlpool under pressure, creating a potential disconnect between short term fear and long term fundamentals.
- Despite that backdrop, Whirlpool clocks a solid 5/6 valuation score, suggesting the market may be underpricing its cash flow potential and asset base. In the sections that follow we will walk through multiple valuation lenses, before finishing with an even more intuitive way to think about what Whirlpool might really be worth.
Find out why Whirlpool's -24.7% return over the last year is lagging behind its peers.
Approach 1: Whirlpool Discounted Cash Flow (DCF) Analysis
A Discounted Cash Flow model estimates what a company is worth by projecting the cash it can generate in the future and then discounting those cash flows back to today in dollar terms.
For Whirlpool, the latest twelve-month Free Cash Flow is slightly negative at around $1.0 million, reflecting near-term pressure on the business. However, analysts and internal estimates expect this to recover meaningfully, with Free Cash Flow projected to reach about $821 million by 2035. These projections combine analyst forecasts for the next several years with Simply Wall St extrapolations for the remainder of the 10-year period, using a 2 Stage Free Cash Flow to Equity model.
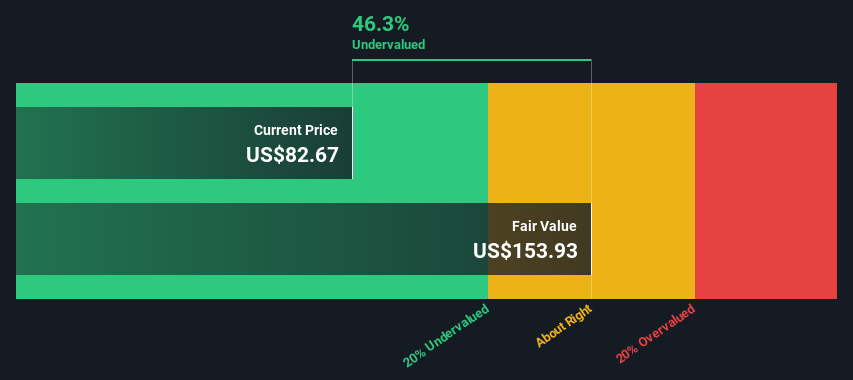
When those future cash flows are discounted back, the DCF model arrives at an intrinsic value of roughly $108.85 per share. Compared with the current share price, this implies Whirlpool is trading at about a 26.6% discount to its estimated fair value. This suggests the market is pricing in a more pessimistic outlook than the cash flow profile supports.
Result: UNDERVALUED
Our Discounted Cash Flow (DCF) analysis suggests Whirlpool is undervalued by 26.6%. Track this in your watchlist or portfolio, or discover 909 more undervalued stocks based on cash flows.
Approach 2: Whirlpool Price vs Sales
For companies like Whirlpool that are working through profit volatility but still generate substantial revenue, the Price to Sales ratio is a useful lens because it focuses on what investors are paying for each dollar of sales, rather than short term earnings noise.
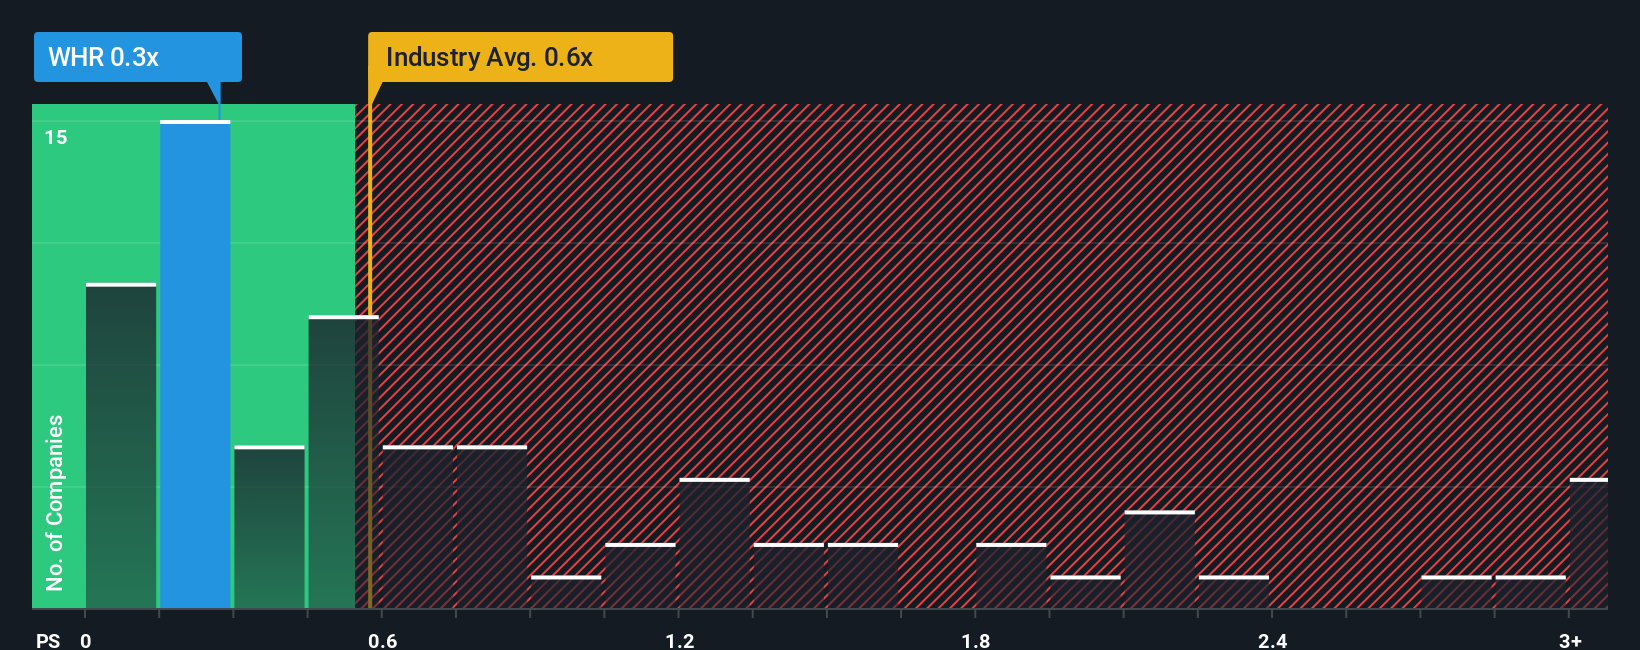
In general, higher growth and lower risk justify a higher normal multiple, while slower growth or more cyclical, uncertain cash flows warrant a lower one. Whirlpool currently trades on a Price to Sales ratio of about 0.29x. That is well below the Consumer Durables industry average of roughly 0.64x and also below the peer group average of around 1.15x. This suggests the market is cautious about its growth and cyclicality.
Simply Wall St’s Fair Ratio metric goes a step further by estimating what Whirlpool’s Price to Sales multiple should be, given its earnings growth profile, margins, risks, industry positioning and market cap. On this basis, Whirlpool’s Fair Ratio is 0.61x. Since this is meaningfully higher than the current 0.29x, the multiple based view lines up with the DCF analysis and indicates the shares are pricing in too much pessimism.
Result: UNDERVALUED
PS ratios tell one story, but what if the real opportunity lies elsewhere? Discover 1442 companies where insiders are betting big on explosive growth.
Upgrade Your Decision Making: Choose your Whirlpool Narrative
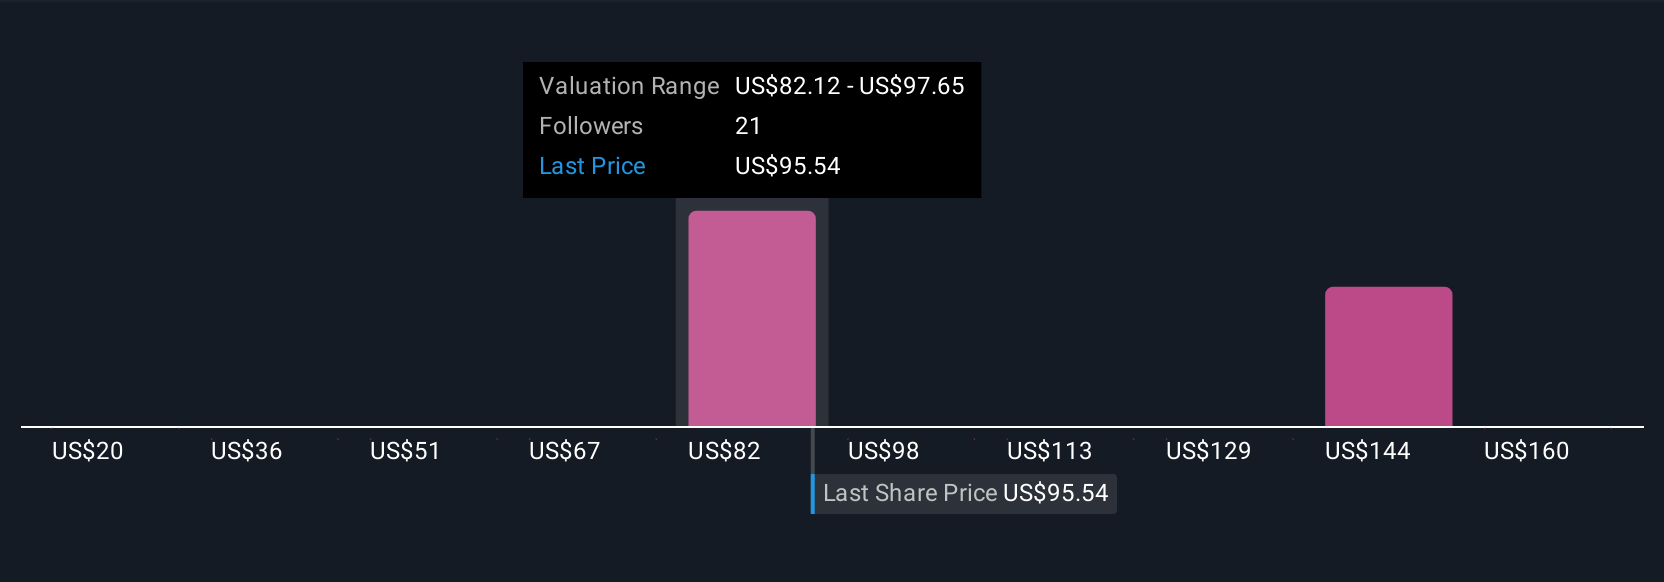
Earlier we mentioned that there is an even better way to understand valuation, so let us introduce you to Narratives, which are simply your story about Whirlpool linked to a set of numbers, like your assumptions for future revenue, earnings, margins and the fair value you think those imply. On Simply Wall St’s Community page, used by millions of investors, a Narrative connects what you believe about the business to a concrete forecast and then to a fair value estimate, and the platform then compares that fair value with the latest share price to help you decide whether Whirlpool looks like a buy, hold or sell right now. Narratives are dynamic and automatically update when new data comes in, such as earnings results or major news, so your view stays anchored in current information rather than going stale. For Whirlpool, one investor might have a bullish Narrative that supports a fair value near the top of the analyst range around $145, while another more cautious investor might build a Narrative closer to $63, and both perspectives can be explored, shared and refined in one place.
Do you think there's more to the story for Whirlpool? Head over to our Community to see what others are saying!
This article by Simply Wall St is general in nature. We provide commentary based on historical data and analyst forecasts only using an unbiased methodology and our articles are not intended to be financial advice. It does not constitute a recommendation to buy or sell any stock, and does not take account of your objectives, or your financial situation. We aim to bring you long-term focused analysis driven by fundamental data. Note that our analysis may not factor in the latest price-sensitive company announcements or qualitative material. Simply Wall St has no position in any stocks mentioned.
Have feedback on this article? Concerned about the content? Get in touch with us directly. Alternatively, email editorial-team@simplywallst.com