
- LIVE QUOTES
- LEARN
- HELP
 Nasdaq
 Wall Street Journal
EN
Is MNTN a Bargain After a 48.8% Slide and DCF Upside in 2025?
- This article explores whether MNTN is a beaten-down bargain or a value trap at current levels, and what the market might be overlooking.
- After sliding 48.8% year to date and another 9.2% over the last month, the stock has only managed a modest 0.7% uptick in the past week. This mix hints at both lingering caution and potential rebound interest.
- Recent headlines have focused on MNTN’s positioning in the evolving media and ad tech landscape, including its push to differentiate in a crowded space and capture more performance-driven ad spend. These developments are shaping how investors interpret the sharp share price pullback and the risks that come with it.
- Right now, MNTN scores a 2 out of 6 valuation checks, suggesting the market only sees limited undervaluation on traditional metrics. Next, we break down what those methods indicate and then consider a more comprehensive way to think about the company’s value by the end of this article.
MNTN scores just 2/6 on our valuation checks. See what other red flags we found in the full valuation breakdown.
Approach 1: MNTN Discounted Cash Flow (DCF) Analysis
A Discounted Cash Flow model estimates what a company is worth by projecting the cash it can generate in the future and then discounting those cash flows back to today in dollar terms.
For MNTN, the latest twelve month Free Cash Flow is about $42.6 million. Analysts and internal estimates expect this to rise steadily, with projections reaching around $193.5 million by 2035, driven by a mix of near term analyst forecasts and longer term extrapolations by Simply Wall St using a 2 Stage Free Cash Flow to Equity approach. These future cash flows are then discounted back to present value and summed to arrive at an intrinsic value per share.
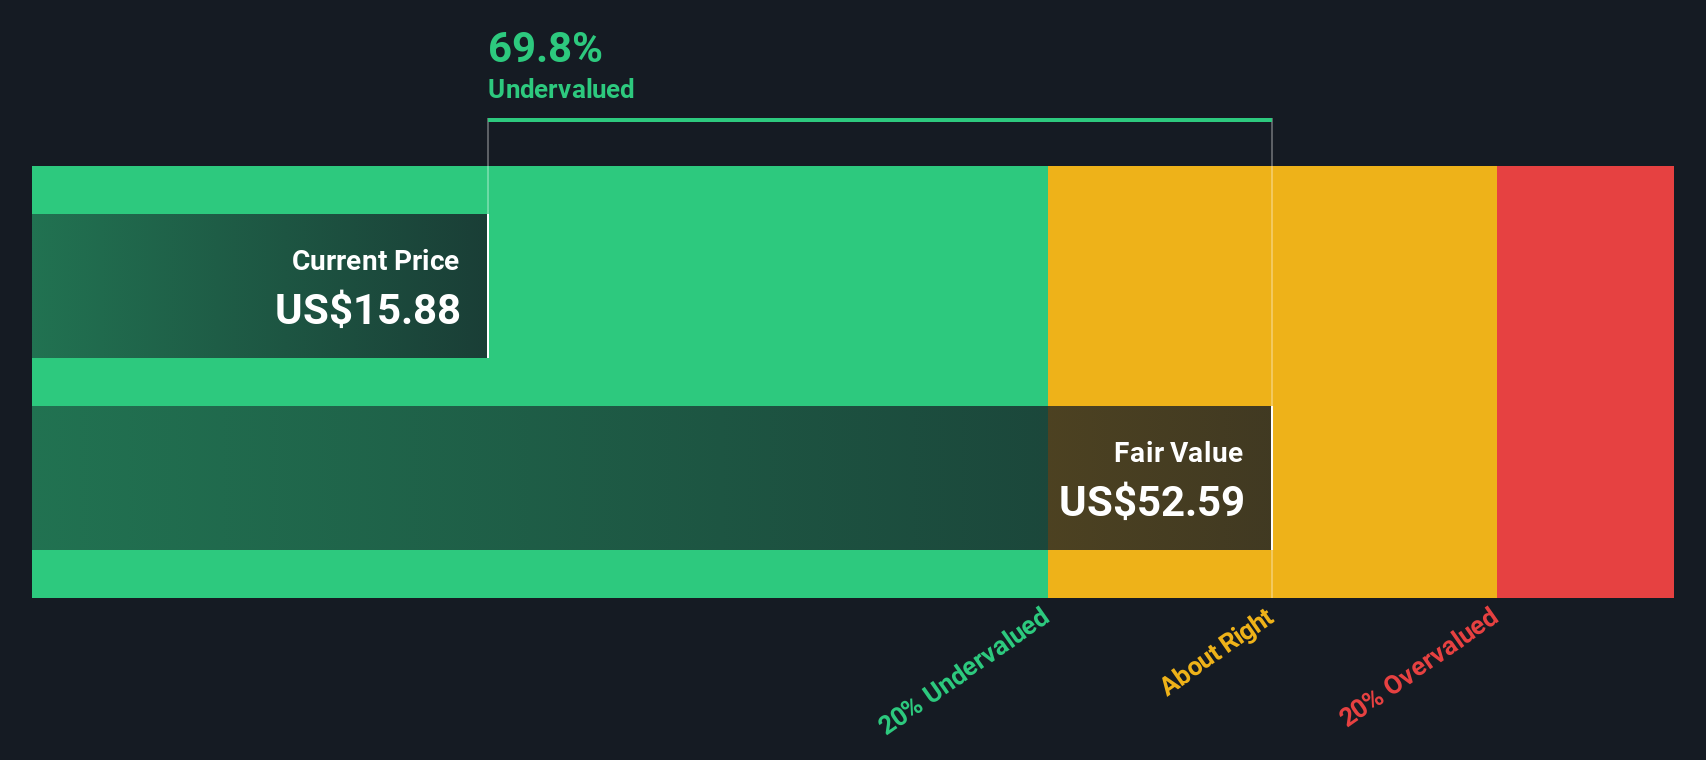
On this basis, MNTN’s DCF fair value is estimated at about $51.24 per share. Compared with the current market price, the model implies the stock is trading at roughly a 73.7% discount. This indicates the market may be heavily discounting MNTN’s long term cash generation potential.
Result: UNDERVALUED
Our Discounted Cash Flow (DCF) analysis suggests MNTN is undervalued by 73.7%. Track this in your watchlist or portfolio, or discover 912 more undervalued stocks based on cash flows.
Approach 2: MNTN Price vs Sales
For growing media and ad tech businesses that are not consistently profitable, the Price to Sales ratio is often a better yardstick than earnings based metrics, because revenue tends to be more stable and less affected by accounting noise or reinvestment cycles. In general, higher growth and lower perceived risk justify a higher sales multiple, while slower growth and greater uncertainty usually warrant a lower one.
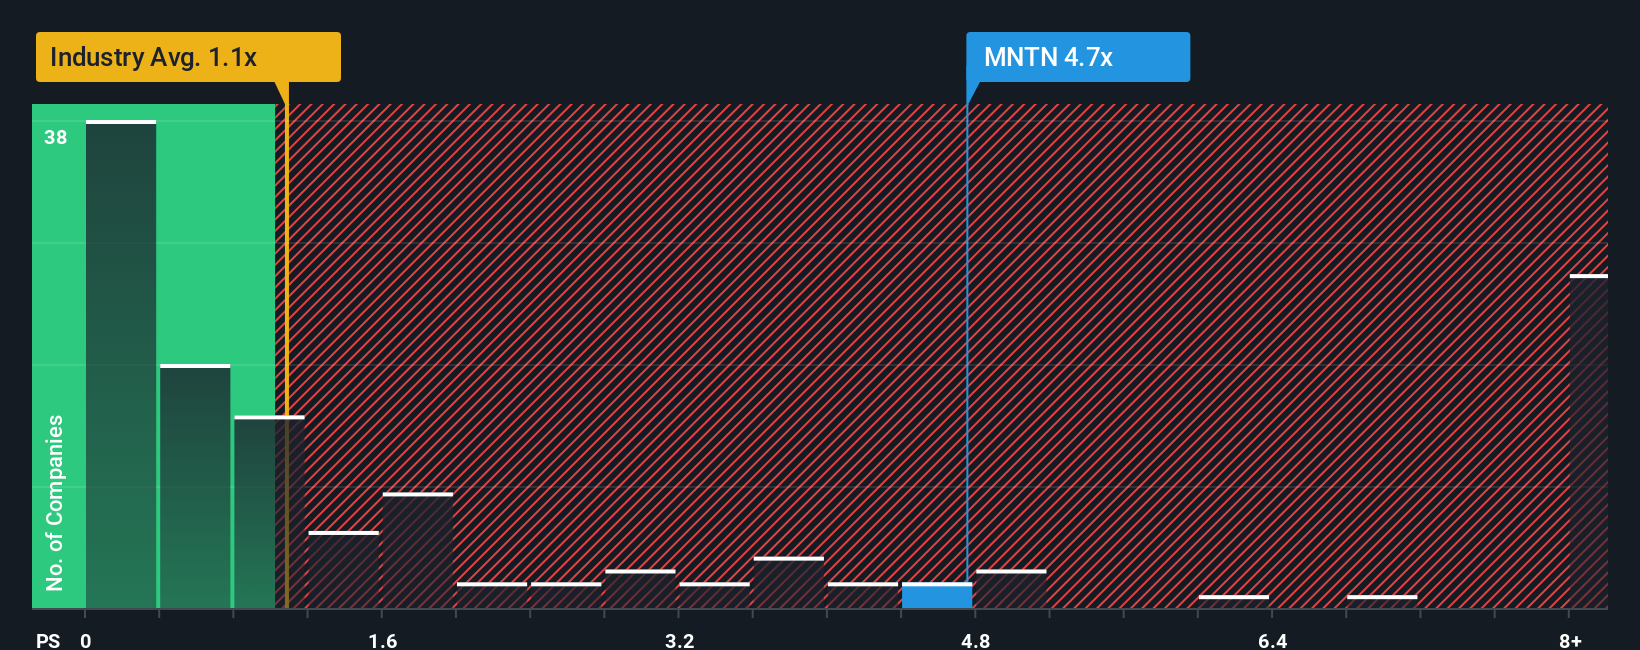
MNTN currently trades at about 3.62x sales, which is meaningfully above the broader Media industry average of roughly 1.08x and also higher than the peer group average of around 1.60x. To refine this comparison, Simply Wall St uses a proprietary “Fair Ratio” that estimates what a suitable Price to Sales multiple should be for MNTN, based on its growth outlook, profitability profile, risk factors, industry positioning and market cap. This makes it more tailored than a simple peer or sector comparison, which can overlook important company specific drivers.
For MNTN, the Fair Ratio is estimated at about 2.45x, noticeably below the current 3.62x. That spread suggests the market is assigning a richer valuation than the company’s fundamentals and risk profile justify.
Result: OVERVALUED
PS ratios tell one story, but what if the real opportunity lies elsewhere? Discover 1442 companies where insiders are betting big on explosive growth.
Upgrade Your Decision Making: Choose your MNTN Narrative
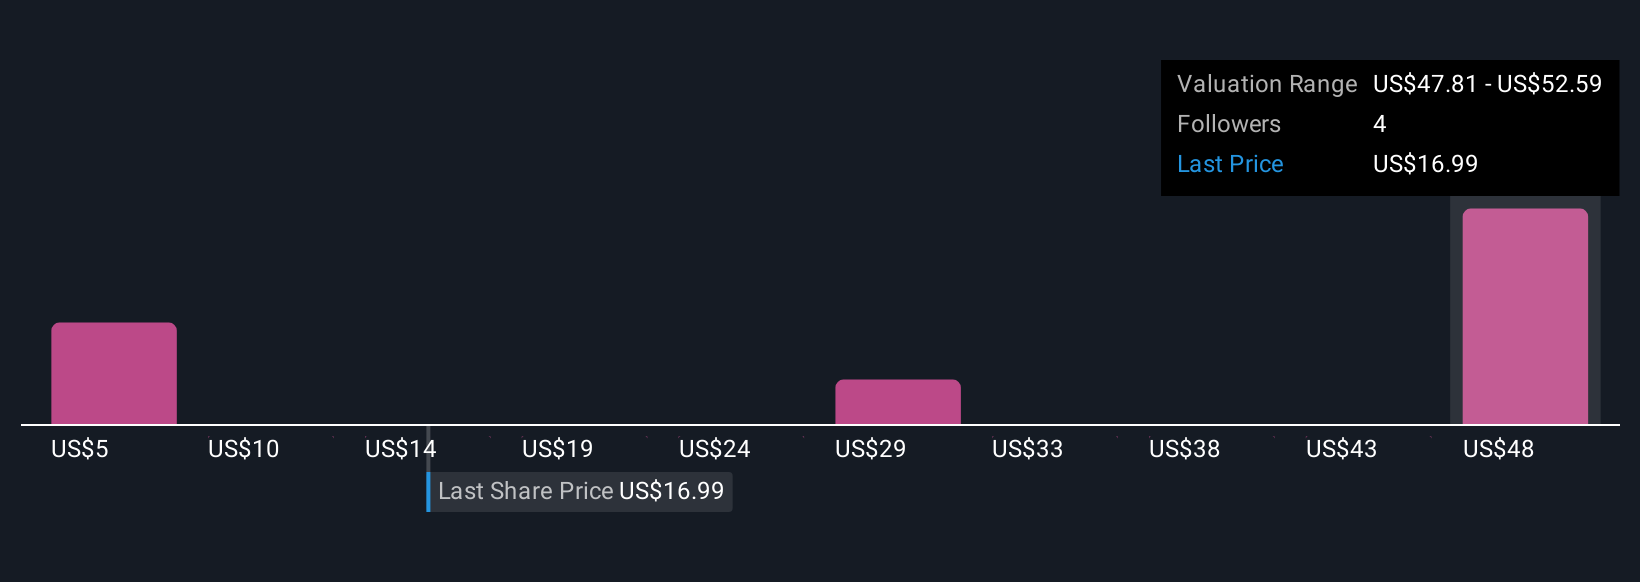
Earlier we mentioned that there is an even better way to understand valuation, so let us introduce you to Narratives, a simple way to connect your view of a company’s story with the numbers behind its fair value. A Narrative is your own investment storyline for MNTN, where you set assumptions about future revenue, earnings and margins, then see how that flows through to a financial forecast and, ultimately, a fair value estimate. On Simply Wall St’s Community page, which is used by millions of investors, Narratives make this process accessible, helping you compare your fair value to today’s market price and consider how much upside or downside you believe is left. Narratives are updated dynamically as new information comes in, so key events like earnings releases or major news automatically refresh the forecasts and valuations. For example, MNTN Narratives can range from a very optimistic fair value with strong revenue growth and expanding margins to a far more cautious view with slower growth and tighter profitability, reflecting different investor perspectives on the same stock.
Do you think there's more to the story for MNTN? Head over to our Community to see what others are saying!
This article by Simply Wall St is general in nature. We provide commentary based on historical data and analyst forecasts only using an unbiased methodology and our articles are not intended to be financial advice. It does not constitute a recommendation to buy or sell any stock, and does not take account of your objectives, or your financial situation. We aim to bring you long-term focused analysis driven by fundamental data. Note that our analysis may not factor in the latest price-sensitive company announcements or qualitative material. Simply Wall St has no position in any stocks mentioned.
Have feedback on this article? Concerned about the content? Get in touch with us directly. Alternatively, email editorial-team@simplywallst.com