
- LIVE QUOTES
- LEARN
- HELP
 Nasdaq
 Wall Street Journal
EN
Does Dow’s Share Price Slide in 2025 Signal a Value Opportunity?
- If you are wondering whether Dow's beaten down share price could actually be setting up a value opportunity, you are not alone in asking whether the current level reflects pessimism or hidden upside.
- Over the last week the stock has slipped around 4.3%, but it is still up about 1.2% over the past month, and that sits against a tough backdrop of roughly 42.2% losses year to date and about 41.7% over the last year.
- Recent headlines have focused on Dow's ongoing cost discipline and portfolio optimization moves, as well as the broader push to decarbonize and modernize chemical production. Together, these themes have been shaping how investors weigh the long term demand outlook against cyclical and macroeconomic headwinds.
- Right now Dow scores a 3/6 valuation score, reflecting that it screens as undervalued on half of the key checks we run. Next, we will unpack what that means under different valuation lenses, before circling back to a more holistic way of thinking about fair value at the end of the article.
Find out why Dow's -41.7% return over the last year is lagging behind its peers.
Approach 1: Dow Dividend Discount Model (DDM) Analysis
The Dividend Discount Model estimates what a stock is worth today by projecting all future dividend payments and discounting them back to their value in $ today.
For Dow, the model starts from an annual dividend per share of about $1.54. However, the company is currently paying out roughly 151% of its earnings as dividends, which means the dividend is not fully covered by profits. With a return on equity of about 6.4%, this high payout leads the model to assume slightly negative long term dividend growth of around 3.3% a year, based on the formula linking growth to retained earnings and return on equity.
Feeding these inputs into the DDM results in an intrinsic value estimate of roughly $13.86 per share. Compared with the current market price, this implies Dow is about 65% overvalued on a dividend basis. This suggests investors are paying a large premium relative to what its current dividend stream appears to justify.
Result: OVERVALUED
Our Dividend Discount Model (DDM) analysis suggests Dow may be overvalued by 65.0%. Discover 913 undervalued stocks or create your own screener to find better value opportunities.
Approach 2: Dow Price vs Sales
For a cyclical chemical company like Dow, the price to sales ratio is a useful yardstick because revenues tend to be more stable than earnings, which can swing with commodity cycles and restructuring charges. Investors usually accept a higher multiple when a business has stronger growth prospects and lower risk, and a lower multiple when growth is modest or the outlook is uncertain.
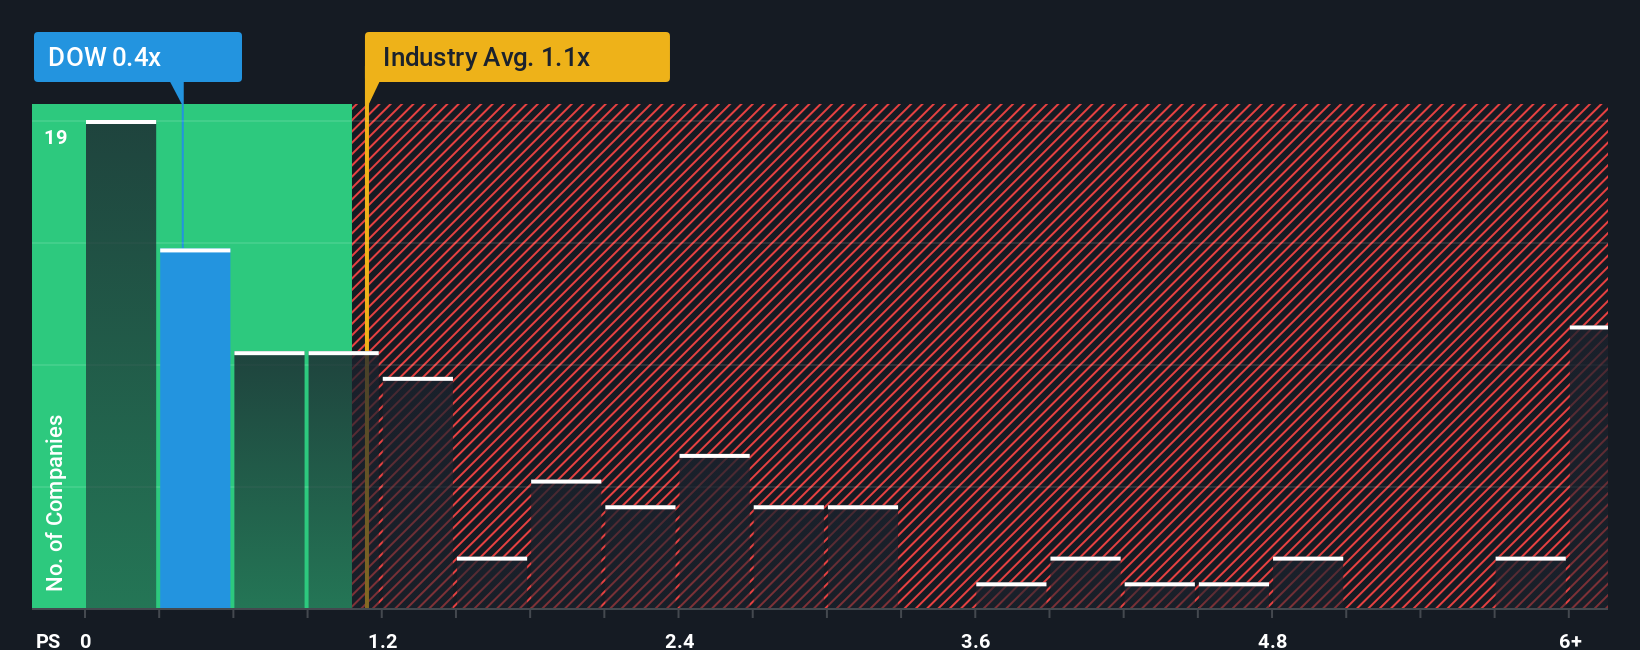
Dow currently trades on a price to sales ratio of about 0.40x, which is well below both the Chemicals industry average of roughly 1.12x and the peer group average of around 0.60x. On the surface, that discount suggests the market is cautious about Dow's earnings power through the cycle.
Simply Wall St's Fair Ratio for Dow, at about 0.84x, estimates what a reasonable price to sales multiple should be after accounting for its growth profile, risk factors, profit margins, industry, and market cap. This makes it more tailored than a simple comparison with peers or the broad industry, which may have very different business mixes and risk levels. Since the Fair Ratio of 0.84x is meaningfully higher than the current 0.40x, the shares screen as undervalued on this basis.
Result: UNDERVALUED
PS ratios tell one story, but what if the real opportunity lies elsewhere? Discover 1442 companies where insiders are betting big on explosive growth.
Upgrade Your Decision Making: Choose your Dow Narrative
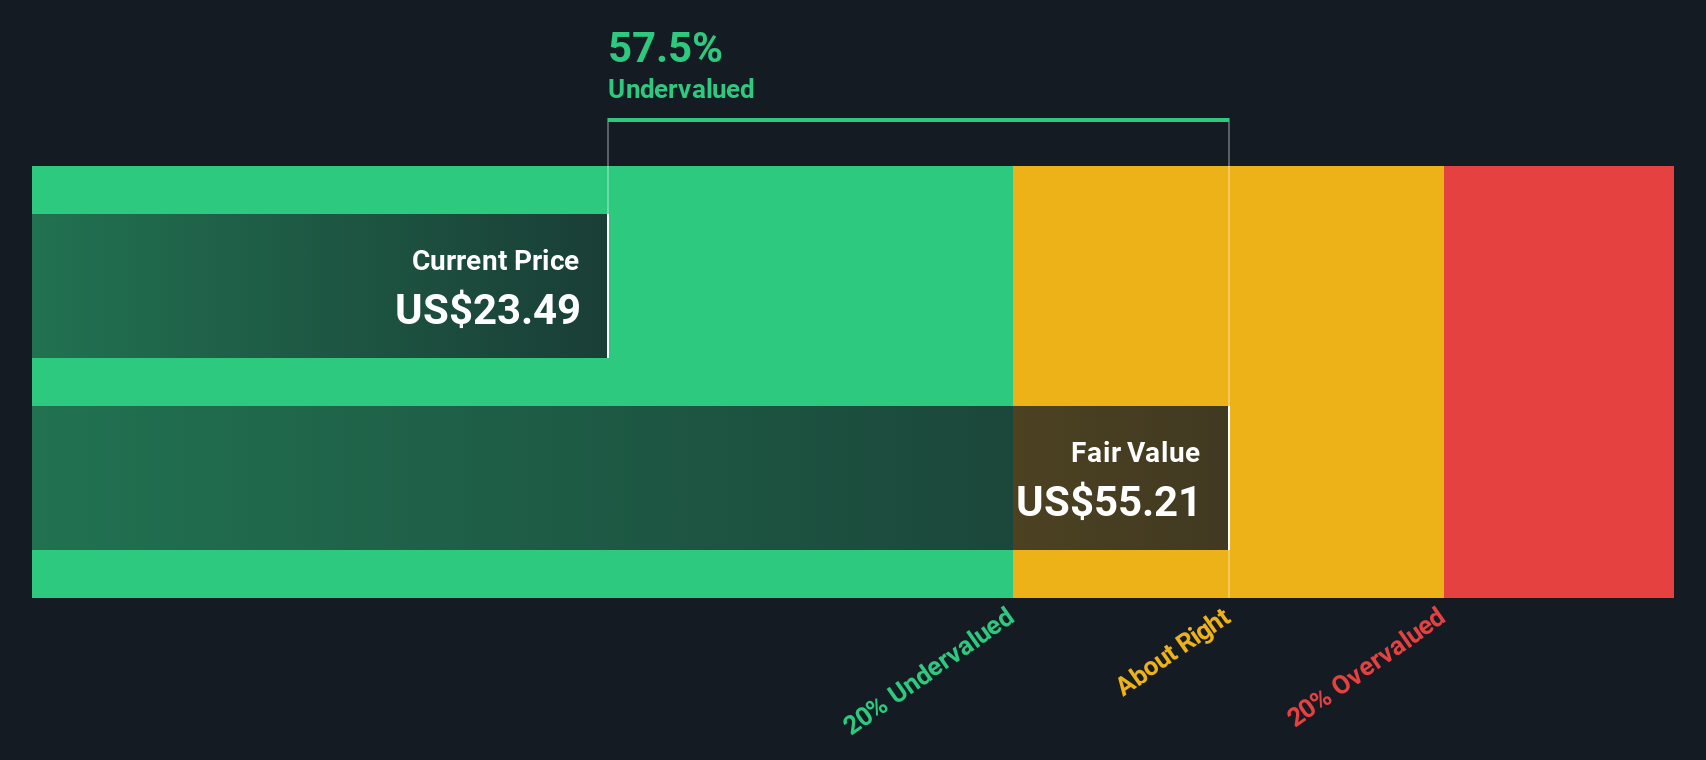
Earlier we mentioned that there is an even better way to understand valuation, so let us introduce Narratives, a simple tool on Simply Wall St's Community page that lets you turn your view of Dow into a clear story that connects your assumptions about future revenue, earnings, and margins to a financial forecast, a Fair Value, and ultimately an investment decision by comparing that Fair Value to the current share price. All of this then updates dynamically as new earnings, news, or guidance arrives. For example, one investor might build a bullish Dow Narrative around cost discipline, asset optimization, and a path to mid single digit margins that supports a Fair Value closer to the high end of recent targets near 45 dollars. A more cautious investor could create a bearish Narrative that assumes prolonged macro headwinds, weaker demand, and lower sustainable margins that justify a Fair Value closer to 20 dollars. Both perspectives can coexist on the platform so you can see how different stories, built from the same data, can lead to very different valuations and decisions.
Do you think there's more to the story for Dow? Head over to our Community to see what others are saying!

This article by Simply Wall St is general in nature. We provide commentary based on historical data and analyst forecasts only using an unbiased methodology and our articles are not intended to be financial advice. It does not constitute a recommendation to buy or sell any stock, and does not take account of your objectives, or your financial situation. We aim to bring you long-term focused analysis driven by fundamental data. Note that our analysis may not factor in the latest price-sensitive company announcements or qualitative material. Simply Wall St has no position in any stocks mentioned.
Have feedback on this article? Concerned about the content? Get in touch with us directly. Alternatively, email editorial-team@simplywallst.com