
- LIVE QUOTES
- LEARN
- HELP
 Nasdaq
 Wall Street Journal
EN
Does Interactive Brokers Still Offer Value After Its 392% Five Year Surge?
- If you are wondering whether Interactive Brokers Group is still a smart buy after its huge run, or if most of the upside is already priced in, you are not alone.
- The stock has dipped 7.9% over the last month after a strong year-to-date gain of 44.5%, and an impressive 41.8% return over the last year that caps a massive 392.4% rise over five years.
- Investors have been reacting to a mix of macro headlines, including shifting expectations for interest rates that directly affect brokerage earnings, as well as ongoing growth in retail and algorithmic trading volumes that support its long-term story. At the same time, market discussions around tighter regulation and competition from zero-commission platforms continue to influence how investors price in future growth and risks.
- Despite that backdrop, Interactive Brokers Group currently scores just 0/6 on our valuation checks, which might surprise anyone looking only at its performance chart. Next, we will walk through different valuation approaches, and then finish with a more holistic way to think about what the market is really willing to pay for this business.
Interactive Brokers Group scores just 0/6 on our valuation checks. See what other red flags we found in the full valuation breakdown.
Approach 1: Interactive Brokers Group Excess Returns Analysis
The Excess Returns model looks at how much profit Interactive Brokers Group can generate above the return that investors demand on its equity, and capitalizes those extra profits into a per share value.
In this framework, the starting point is book value, or the equity invested in the business, which stands at about $11.47 per share, with a stable book value estimate of $13.72 per share based on analyst forecasts. From that equity base, analysts expect stable earnings of roughly $2.33 per share, implying an average return on equity of 16.98%.
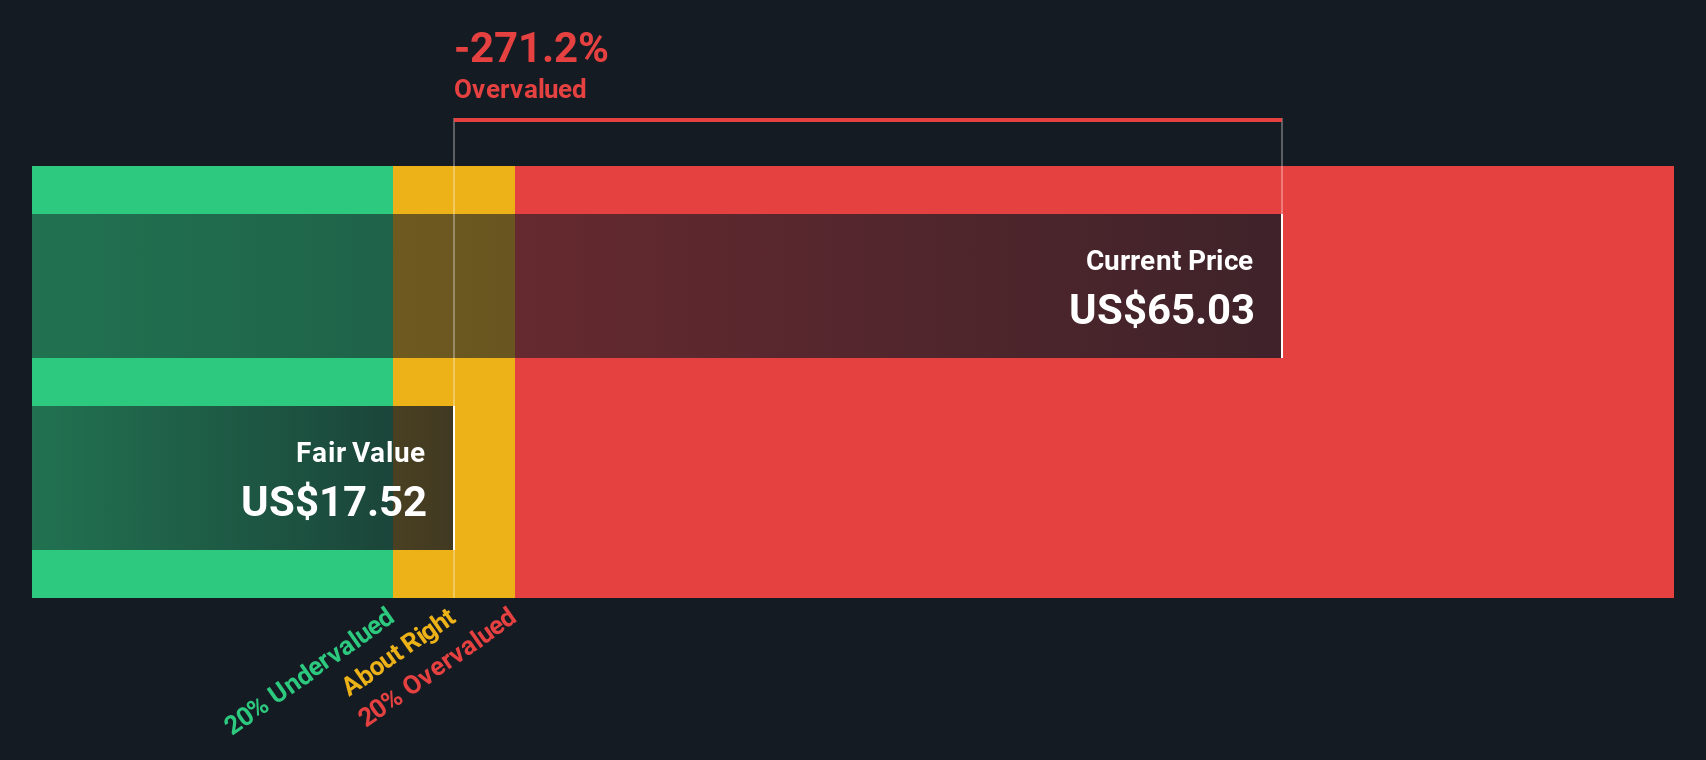
Against a cost of equity of $1.20 per share, this leaves an estimated excess return of $1.13 per share. The model projects that excess return into the future and discounts it back to arrive at an intrinsic value of about $34.15 per share. Compared with the current market price, this suggests the stock is roughly 93.1% overvalued under this method.
Result: OVERVALUED
Our Excess Returns analysis suggests Interactive Brokers Group may be overvalued by 93.1%. Discover 911 undervalued stocks or create your own screener to find better value opportunities.
Approach 2: Interactive Brokers Group Price vs Earnings
For profitable companies like Interactive Brokers Group, the price to earnings ratio is a useful yardstick because it directly links what investors pay for the stock to the profits the business is currently generating. In general, faster growth and lower perceived risk justify a higher PE multiple, while slower or more volatile earnings typically warrant a lower one.
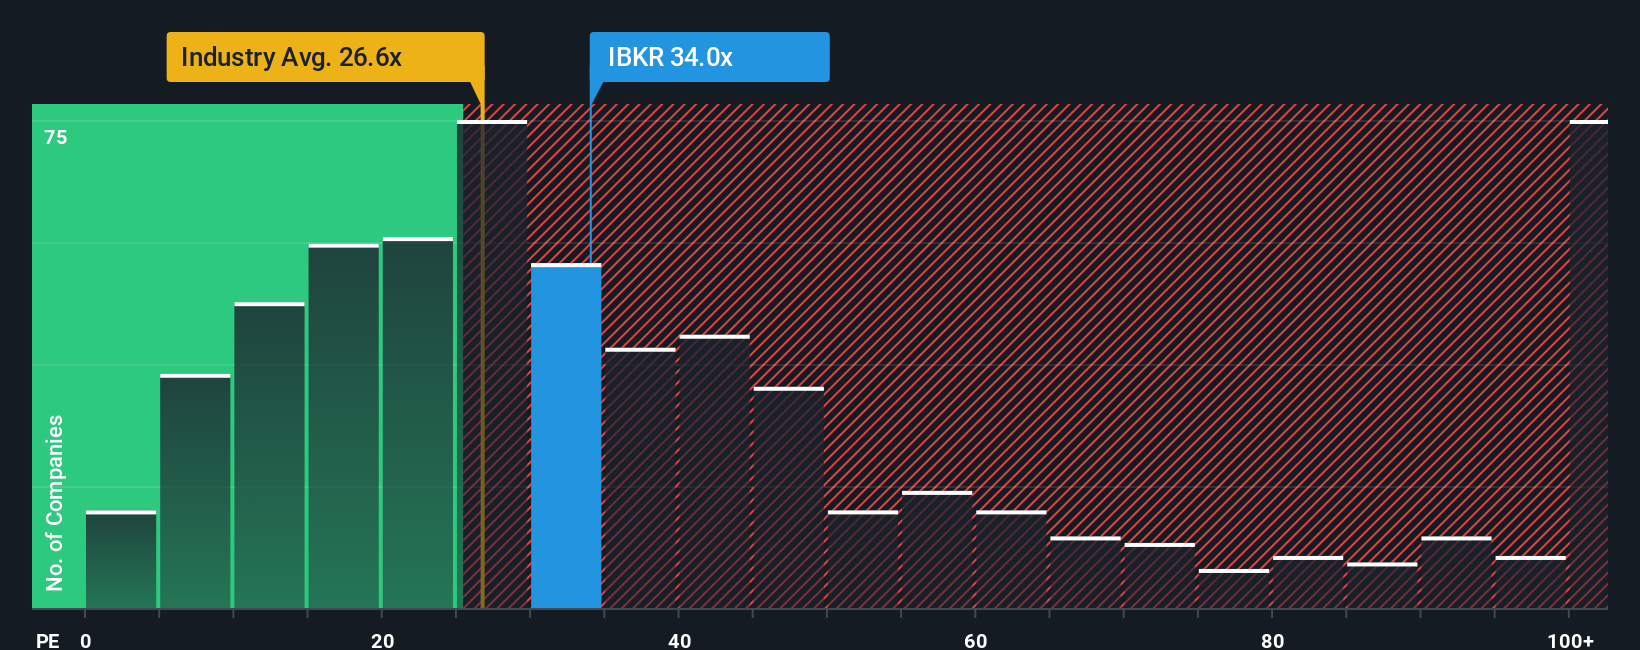
Interactive Brokers is currently trading on a PE of about 32.0x, which is above both the Capital Markets industry average of roughly 24.0x and the peer group average of around 28.1x. At first glance, that premium suggests investors are paying up for the company’s earnings profile compared to its sector.
Simply Wall St’s Fair Ratio framework goes a step further by estimating what PE multiple would be reasonable given Interactive Brokers’ specific mix of earnings growth, profitability, industry, market cap and risk factors. For IBKR, that Fair Ratio is 21.6x, noticeably below the current 32.0x. Because the Fair Ratio incorporates company specific fundamentals rather than just broad peer comparisons, it provides a more tailored view of value. On this basis the shares appear meaningfully overvalued.
Result: OVERVALUED
PE ratios tell one story, but what if the real opportunity lies elsewhere? Discover 1440 companies where insiders are betting big on explosive growth.
Upgrade Your Decision Making: Choose your Interactive Brokers Group Narrative
Earlier we mentioned that there is an even better way to understand valuation, so let us introduce you to Narratives, a simple way to attach your own story about Interactive Brokers Group to the numbers you care about, such as its fair value, and your expectations for future revenue, earnings and margins.
A Narrative connects three pieces: the company’s story, a concrete financial forecast built from that story, and a resulting fair value that you can compare directly with the current share price to decide whether IBKR looks like a buy, a hold, or a sell for you.
On Simply Wall St’s Community page, used by millions of investors, Narratives are easy to create and update. They automatically refresh when new information like earnings releases or major news changes the outlook.
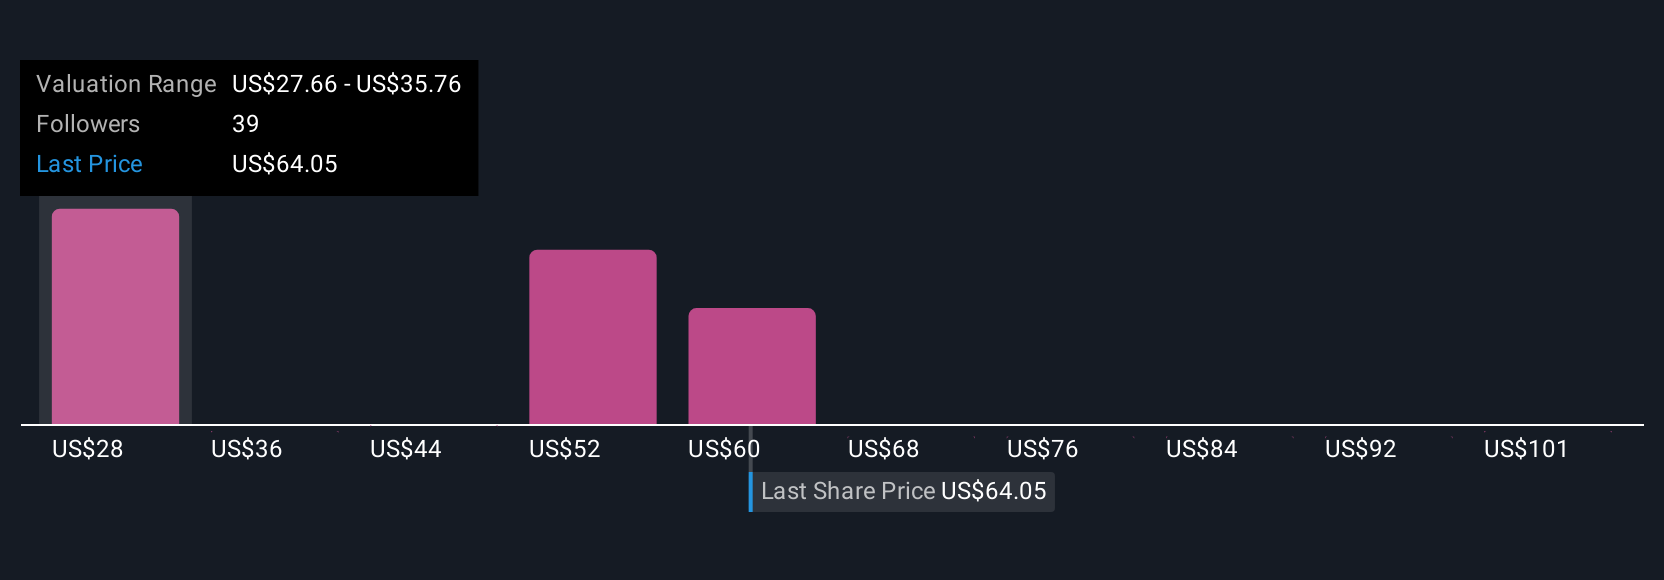
For example, one IBKR Narrative might lean into rapid global expansion, robust client balance growth and high operating margins to support a higher fair value closer to the most bullish target of about $288. A more cautious Narrative might focus on interest rate risk, competition and reliance on trading volumes to anchor a lower fair value nearer $140. Both perspectives can coexist on the platform so you can see exactly which assumptions you agree with.
Do you think there's more to the story for Interactive Brokers Group? Head over to our Community to see what others are saying!
This article by Simply Wall St is general in nature. We provide commentary based on historical data and analyst forecasts only using an unbiased methodology and our articles are not intended to be financial advice. It does not constitute a recommendation to buy or sell any stock, and does not take account of your objectives, or your financial situation. We aim to bring you long-term focused analysis driven by fundamental data. Note that our analysis may not factor in the latest price-sensitive company announcements or qualitative material. Simply Wall St has no position in any stocks mentioned.
Have feedback on this article? Concerned about the content? Get in touch with us directly. Alternatively, email editorial-team@simplywallst.com