
- LIVE QUOTES
- LEARN
- HELP
 Nasdaq
 Wall Street Journal
EN
Is CRA International Still Attractive After Multi Year Rally and New Advisory Mandates?
- If you are wondering whether CRA International is still worth buying after its big multi year run or just coasting on past success, you are not alone. This piece unpacks what the current share price really implies.
- The stock has pulled back about 4.3% over the last month and is roughly flat year to date. Zooming out, it is still up 61.0% over 3 years and 272.1% over 5 years, which keeps growth minded investors interested even after a softer 12 month return of around 4.1%.
- Recent headlines have centered on CRA International winning new advisory mandates and expanding its footprint in antitrust and regulatory consulting, areas where demand tends to stay resilient across cycles. This kind of contract and reputation driven growth story helps explain why the market has been willing to re rate the shares over the longer term, even if short term sentiment wobbles.
- Right now, CRA International scores a 4 out of 6 on our undervaluation checks, and you can see the breakdown in our valuation score. Next, we will walk through the different valuation approaches behind that number and then finish by looking at a more holistic way to judge what the stock is really worth.
Approach 1: CRA International Discounted Cash Flow (DCF) Analysis
A Discounted Cash Flow model estimates what a stock is worth by projecting the cash the business is expected to generate in the future and then discounting those cash flows back to today in dollar terms.
For CRA International, the model uses a 2 Stage Free Cash Flow to Equity approach. The company generated around $33.6 million in free cash flow over the last twelve months, and analyst expectations plus Simply Wall St extrapolations point to this rising steadily. For example, free cash flow is projected to reach about $77.4 million by 2026 and roughly $113.0 million by 2035, with growth moderating over time as the business matures.
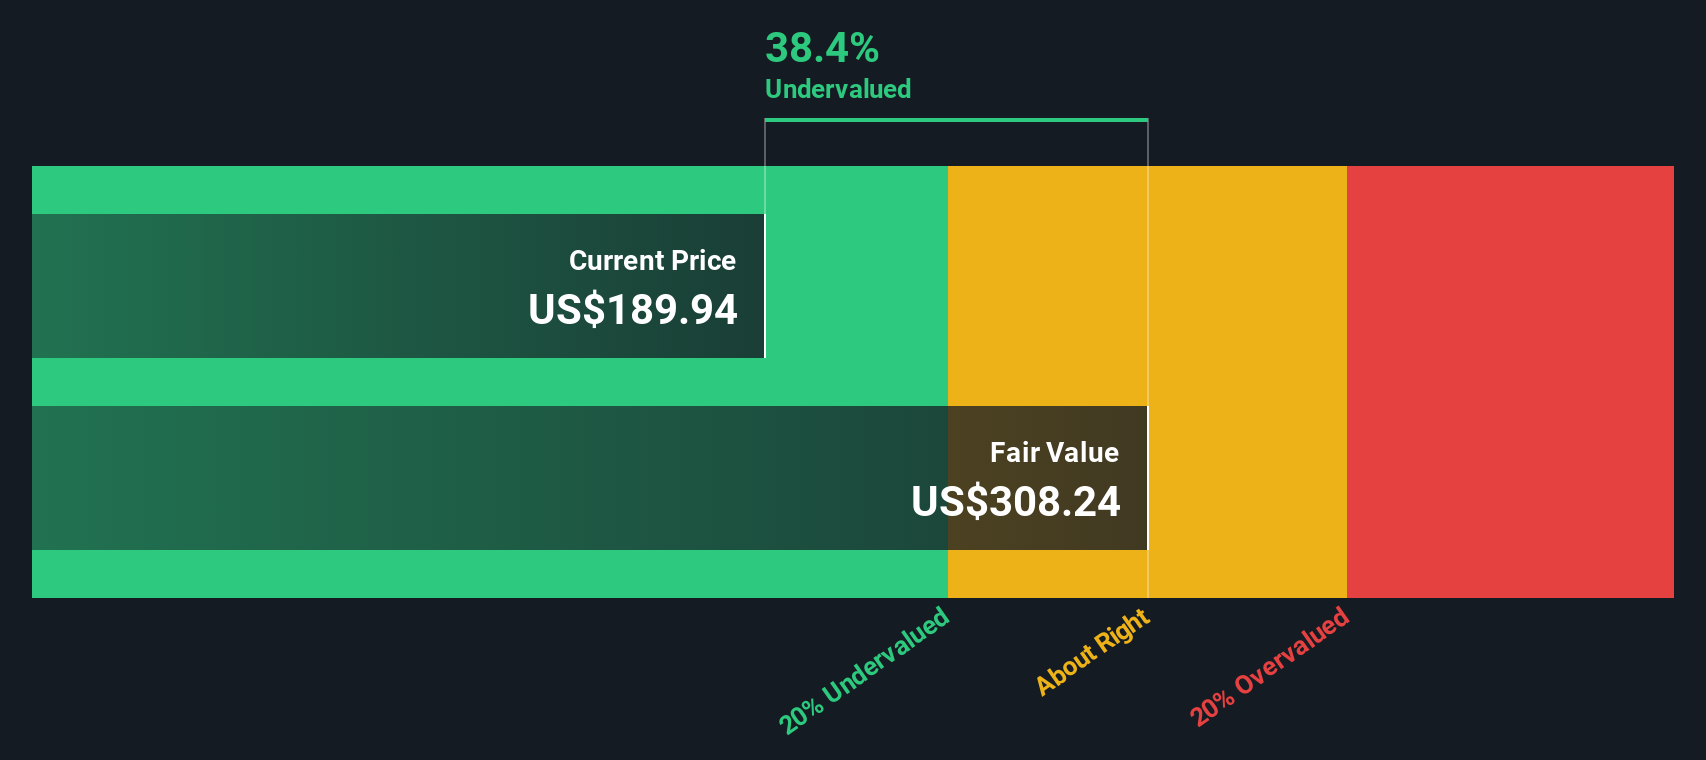
When all of these projected cash flows are discounted back, the intrinsic value comes out at roughly $304.82 per share. That is about 39.9% above the current share price implied by the model, suggesting the market is still pricing CRA International quite conservatively relative to its cash generation outlook.
Result: UNDERVALUED
Our Discounted Cash Flow (DCF) analysis suggests CRA International is undervalued by 39.9%. Track this in your watchlist or portfolio, or discover 927 more undervalued stocks based on cash flows.
Approach 2: CRA International Price vs Earnings
For profitable, established businesses like CRA International, the price to earnings ratio is a practical way to judge value because it ties the share price directly to the profits that shareholders ultimately care about. What counts as a reasonable PE multiple depends on how fast earnings are expected to grow and how risky those earnings are, since investors will usually pay a higher multiple for faster, more reliable growth.
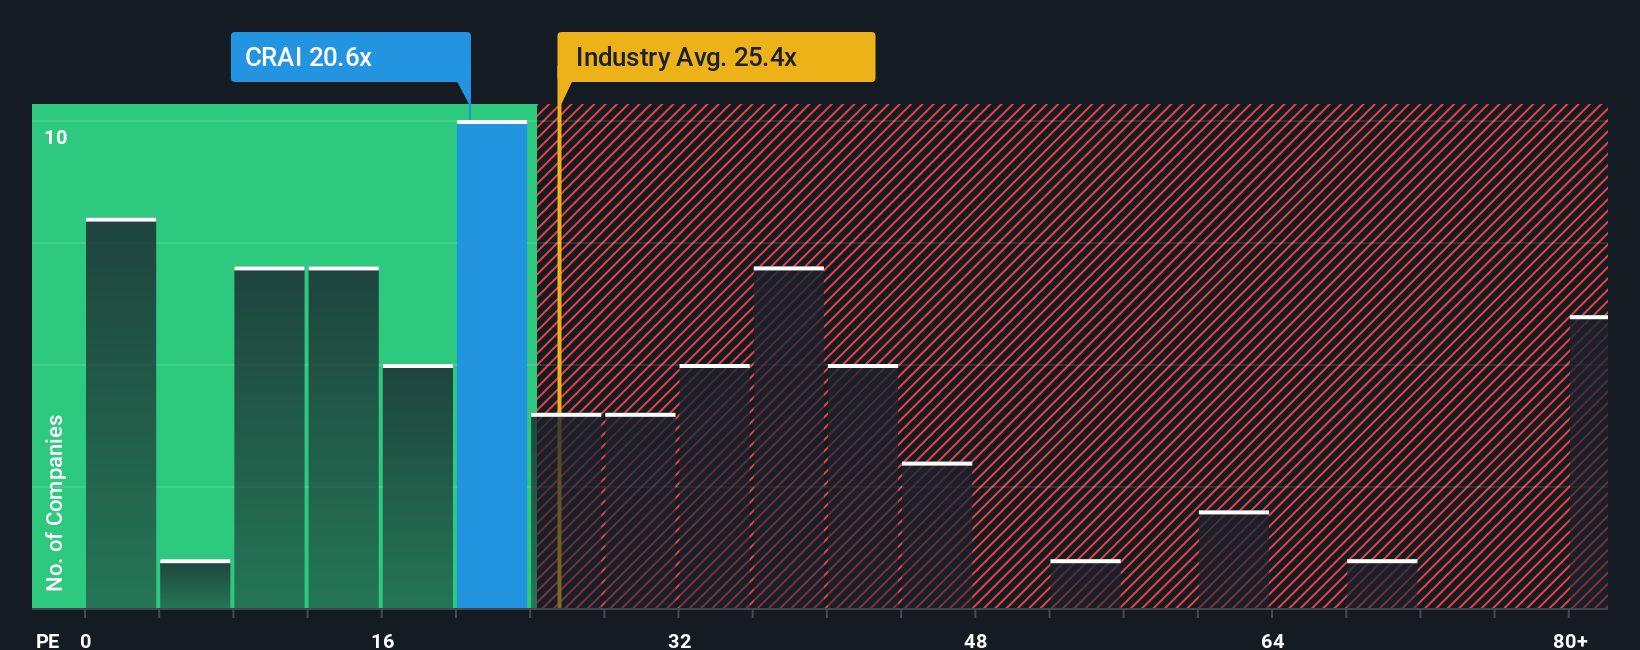
CRA International currently trades on a PE of about 21.29x. That sits below both the broader Professional Services industry average of roughly 24.31x and the peer group average of around 34.44x, suggesting the market is not paying a premium for the company despite its solid track record. Simply Wall St also calculates a proprietary Fair Ratio of 17.95x, which is the PE that might be expected based on CRA International’s growth profile, profitability, size, industry and specific risks.
This Fair Ratio is more tailored than a simple peer or industry comparison because it adjusts for the company’s own fundamentals rather than assuming it deserves the same multiple as everyone else. With the current PE of 21.29x sitting notably above the Fair Ratio of 17.95x, the stock screens as somewhat expensive on an earnings basis.
Result: OVERVALUED
PE ratios tell one story, but what if the real opportunity lies elsewhere? Discover 1440 companies where insiders are betting big on explosive growth.
Upgrade Your Decision Making: Choose your CRA International Narrative
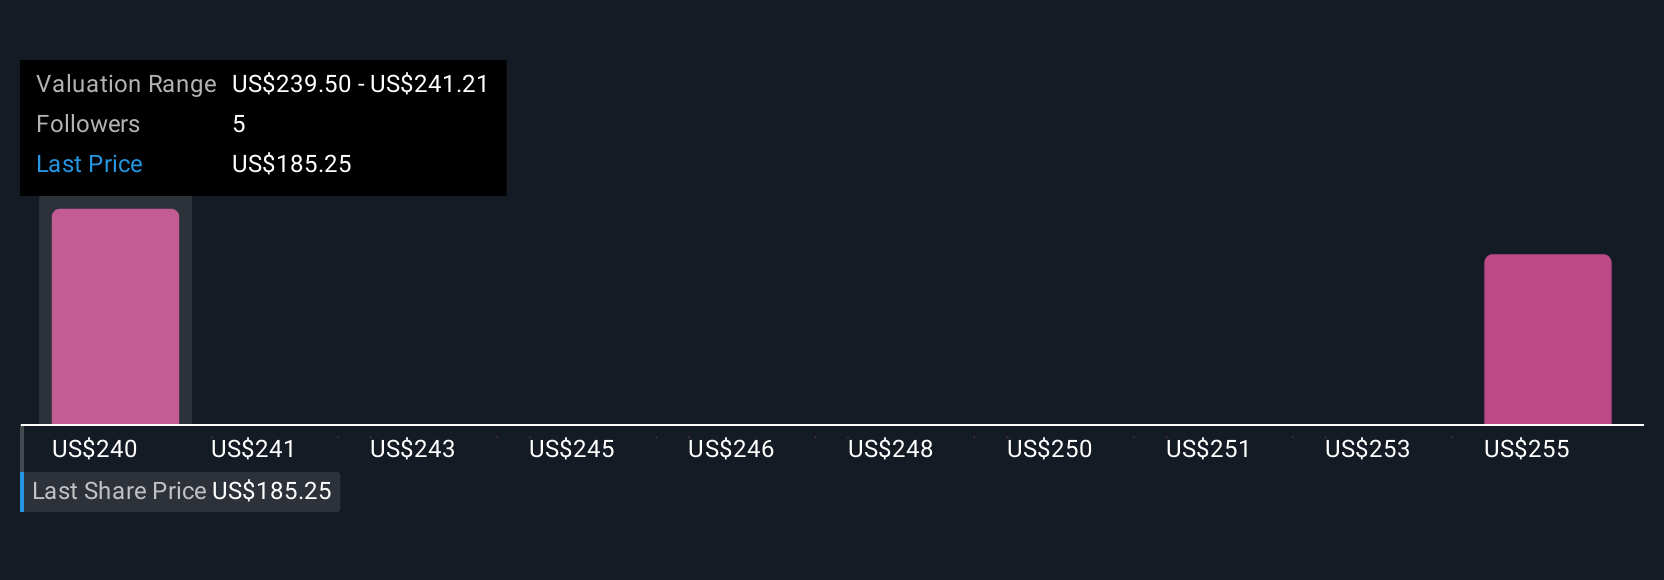
Earlier we mentioned that there is an even better way to understand valuation, so let us introduce you to Narratives, an easy tool on Simply Wall St’s Community page that lets you connect your view of CRA International’s story to concrete forecasts for revenue, earnings and margins, and then to a fair value estimate that is continuously updated as news or earnings arrive. This means you can quickly compare Fair Value to the current Price and decide whether it is a buy, hold or sell for you. You might lean toward a more optimistic view that rising regulatory complexity, M and A activity, buybacks and dividend growth will support higher long term earnings and a fair value closer to the upper end of community estimates around $249.50. Alternatively, you may prefer a more cautious stance that slower growth, talent risks and financial leverage justify a lower fair value toward the bottom of the range, with both perspectives coexisting as different Narratives on the same stock.
Do you think there's more to the story for CRA International? Head over to our Community to see what others are saying!
This article by Simply Wall St is general in nature. We provide commentary based on historical data and analyst forecasts only using an unbiased methodology and our articles are not intended to be financial advice. It does not constitute a recommendation to buy or sell any stock, and does not take account of your objectives, or your financial situation. We aim to bring you long-term focused analysis driven by fundamental data. Note that our analysis may not factor in the latest price-sensitive company announcements or qualitative material. Simply Wall St has no position in any stocks mentioned.
Have feedback on this article? Concerned about the content? Get in touch with us directly. Alternatively, email editorial-team@simplywallst.com