
- LIVE QUOTES
- LEARN
- HELP
 Nasdaq
 Wall Street Journal
EN
Has the Recent Surge in Vicor Shares Made the Stock Too Pricey for 2025?
- Ever wondered whether Vicor is really worth its current price tag? You are not alone. Let’s take a closer look at what recent data says about its true value.
- Vicor’s stock has been riding a wave of momentum, jumping 5.3% in the last week and surging 85.7% year-to-date, with an impressive 67.9% gain over the last year.
- These price moves come amid industry buzz around renewed demand for Vicor’s advanced power modules and growing attention from institutional investors. The company’s partnerships in emerging tech sectors have kept it in the spotlight, fueling optimism and debate among market watchers.
- According to our valuation checks, Vicor currently scores 0 out of 6, indicating it is not undervalued by any of our standard metrics. Next, we will break down what those traditional approaches show. Stick around, because there is an even better way to think about value that we will cover at the end.
Vicor scores just 0/6 on our valuation checks. See what other red flags we found in the full valuation breakdown.
Approach 1: Vicor Discounted Cash Flow (DCF) Analysis
The Discounted Cash Flow (DCF) model estimates a company’s intrinsic value by forecasting how much cash it will generate in the future, then discounting those cash flows back to today’s value. This approach helps investors gauge whether the current market price reflects the business’s real earnings power over time.
For Vicor, the latest reported Free Cash Flow is $103.2 million. Analyst forecasts predict this will grow to $129.6 million by the end of 2027. After that, further future cash flows are extrapolated by industry models to reach $193.1 million in 2035. All figures are in US dollars and reflect underlying estimates rather than guaranteed outcomes.
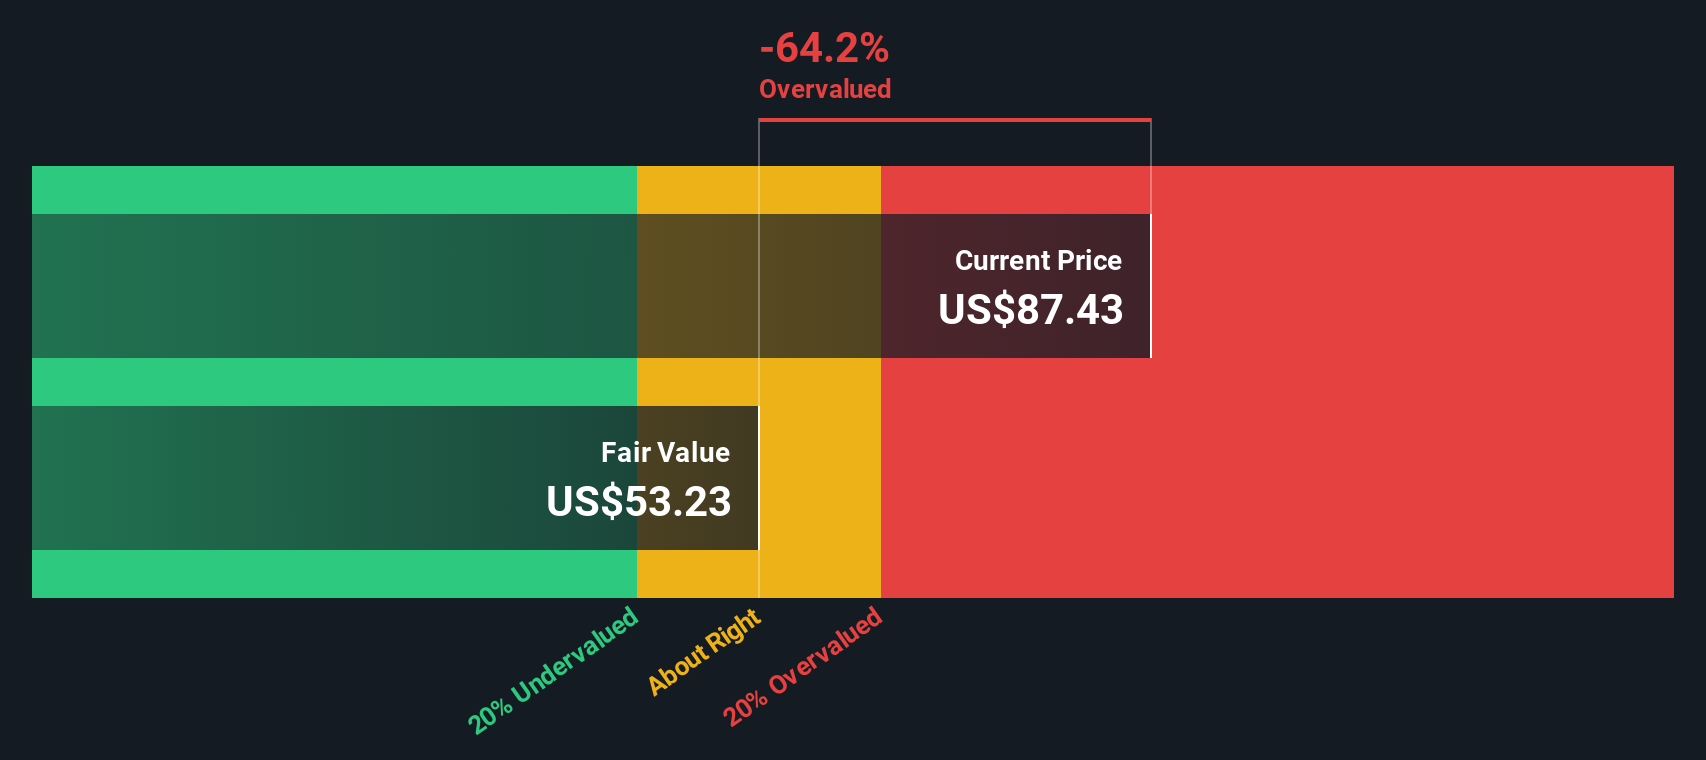
Based on these projections, Simply Wall St’s 2 Stage Free Cash Flow to Equity model arrives at an estimated intrinsic value of $54.45 per share for Vicor. With the stock currently trading substantially higher, the DCF model implies Vicor is about 64.4% overvalued compared to its intrinsic value using this traditional method.
Result: OVERVALUED
Our Discounted Cash Flow (DCF) analysis suggests Vicor may be overvalued by 64.4%. Discover 932 undervalued stocks or create your own screener to find better value opportunities.
Approach 2: Vicor Price vs Earnings
The Price-to-Earnings (PE) ratio is one of the most commonly used tools for valuing profitable companies like Vicor, because it links a company's current share price with its net earnings. For investors, the PE ratio helps put stock prices in perspective and sheds light on what the market is willing to pay today for a dollar of future earnings.
It is important to understand that growth expectations and perceived risks play a big part in deciding what a "normal" or "fair" PE should be. Fast-growing companies or those with more stable earnings often command higher multiples, while slower or riskier peers might see much lower numbers.
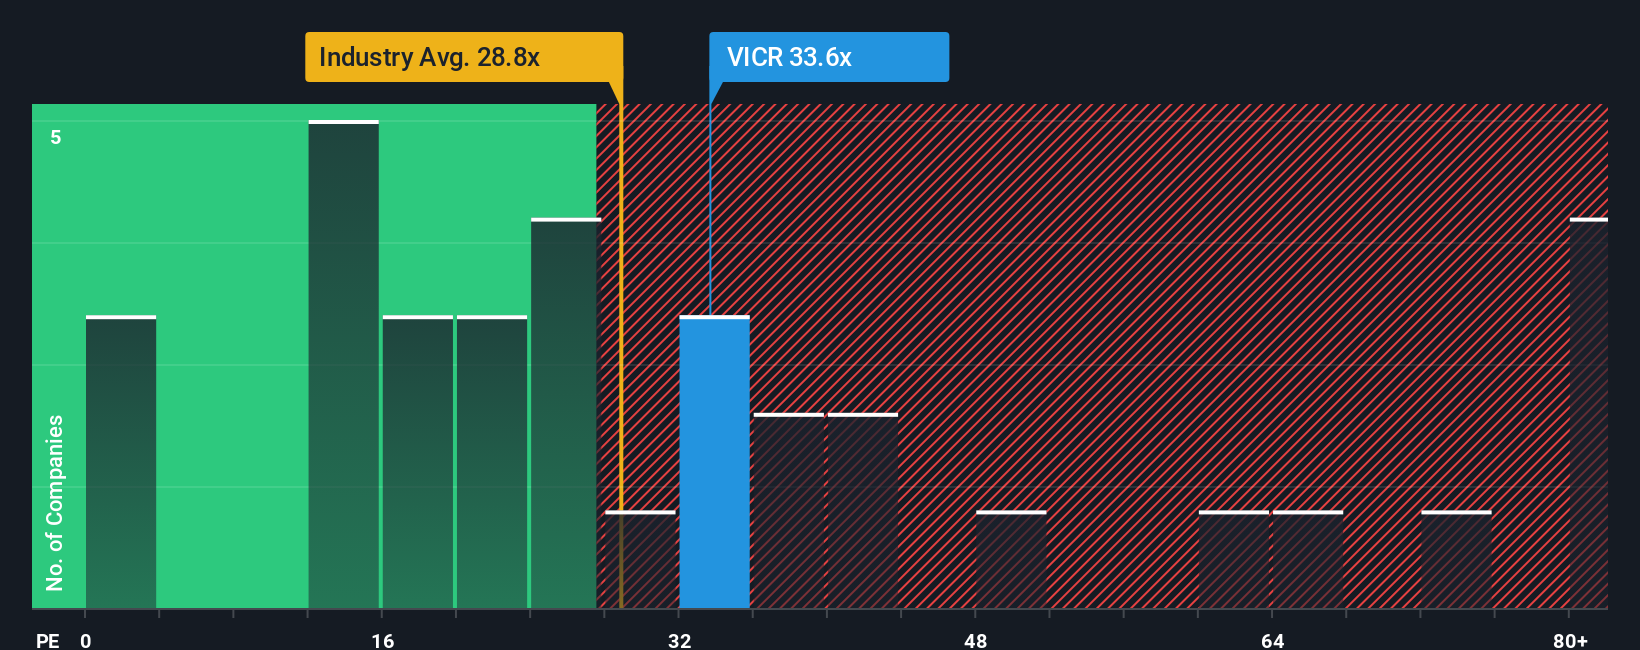
Currently, Vicor’s PE ratio stands at 48.6x. That is significantly higher than both the Electrical industry average of 30.8x and the average of close peers at 25.7x. While these benchmarks offer useful context, Simply Wall St provides an even more tailored figure called the "Fair Ratio," which in this case is 35.9x. This proprietary metric blends factors such as expected earnings growth, risk profile, profitability, industry standards, and Vicor’s market cap, making it a more nuanced yardstick than a simple industry or peer comparison.
With Vicor trading at a PE ratio notably above its Fair Ratio, the evidence suggests the stock is overvalued on this measure.
Result: OVERVALUED
PE ratios tell one story, but what if the real opportunity lies elsewhere? Discover 1441 companies where insiders are betting big on explosive growth.
Upgrade Your Decision Making: Choose your Vicor Narrative
Earlier, we mentioned that there is an even better way to understand valuation, so let us introduce you to Narratives. A Narrative is a simple, personal story that lets you tie your view of a company like Vicor directly to a financial forecast and arrive at your own sense of fair value. Instead of relying on a single metric, Narratives empower you to lay out your expectations for revenue growth, profit margins, and risk factors, all while grounding your opinion in real business trends and market developments.
Available through the Simply Wall St Community page, trusted by millions of investors, Narratives make it easy for anyone to build, compare, and track investment stories. You can see how your story stacks up next to others and decide when to buy, hold, or sell by comparing your Narrative-based Fair Value to the current share price. Narratives update automatically anytime key news or financial results are released, keeping your thinking current without extra effort.
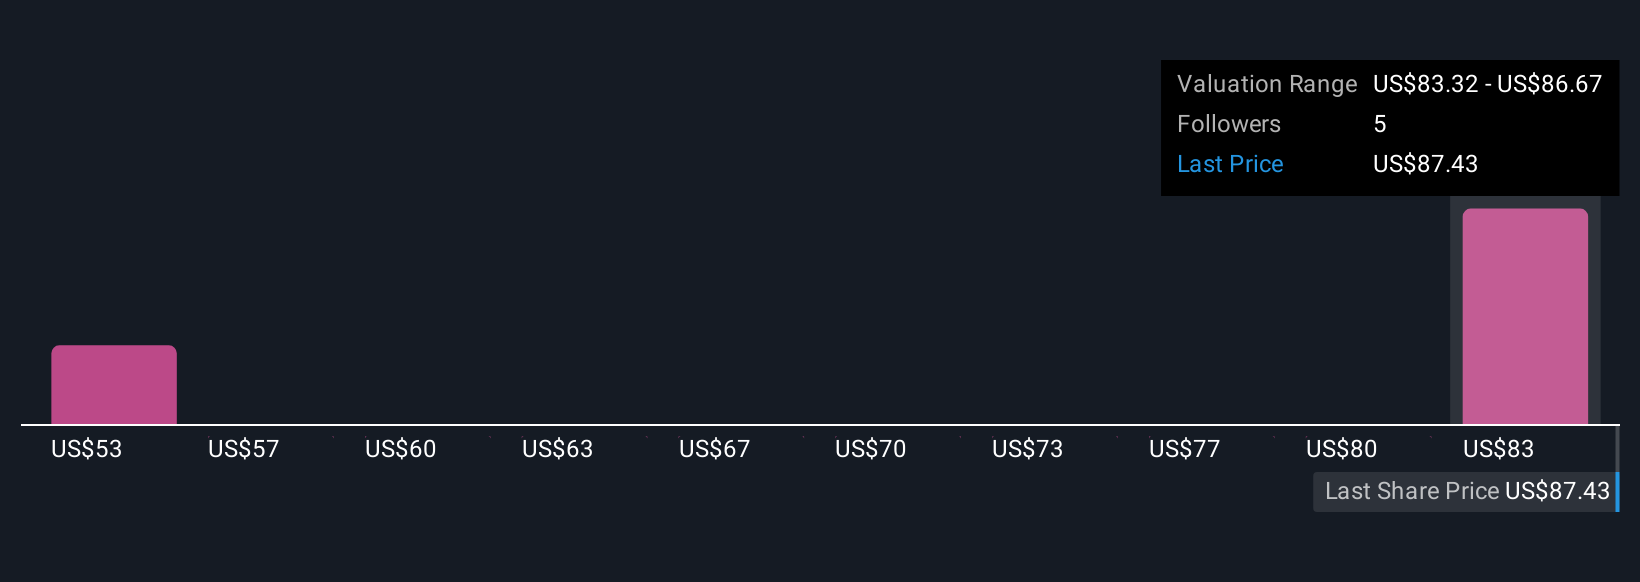
For Vicor, some investors are bullish, forecasting high growth and profit margins and setting their Narrative Fair Value as high as $86.67 per share, while others are more cautious and estimate a much lower value, showing just how flexible and insightful this approach can be.
Do you think there's more to the story for Vicor? Head over to our Community to see what others are saying!
This article by Simply Wall St is general in nature. We provide commentary based on historical data and analyst forecasts only using an unbiased methodology and our articles are not intended to be financial advice. It does not constitute a recommendation to buy or sell any stock, and does not take account of your objectives, or your financial situation. We aim to bring you long-term focused analysis driven by fundamental data. Note that our analysis may not factor in the latest price-sensitive company announcements or qualitative material. Simply Wall St has no position in any stocks mentioned.
Have feedback on this article? Concerned about the content? Get in touch with us directly. Alternatively, email editorial-team@simplywallst.com